Category Archives: East vs West

East vs. West Week 1: Strong start to the 2014-15 season for the West

One week of non-conference play is in the books, and the West finished 6-1 against the East. The only loss came on Saturday night when Minnesota lost a close one against a Derrick Rose and Taj Gibson-less Bulls squad. The West did score some key wins, though, like Memphis over Charlotte in a game that felt like 2004 (the dead ball era) all over again.

Below is a breakdown of the first week. It’s much like the ones I did last year but with some new additions relating to Pythagorean record. Like last year, this table will also be updated weekly:

Though a large number through seven games, point differential says the West ran slightly better than expected. That’s probably thanks to Minnesota holding on against the Pistons Thursday night after blowing a 19-point lead in the 3rd quarter.

Week 1 is the last of light non-conference weeks until the all-star break. There will be 17 non-conference games in Week 2 and it will pick up even more after that. The teams most often in the Week 2 matchups are Minnesota, Cleveland, and Miami with three games each. Below are some of the most important games:

Monday:

Oklahoma City @ Brooklyn
Houston @ Miami

Tuesday:

Oklahoma City @ Toronto
Cleveland @ Portland

Sunday:

Miami @ Dallas

It looks like the East has one extra home game in Week 2 than the West, and the five key games listed above feature three of them on East courts. The East will have actually have a nice home-court stretch through Week 5, playing seven more home games than the West by then.

So starting with Cleveland playing three non-conference games this week, this could either be a stretch where the East gains some ground or the beginning of an onslaught by the West.

Non-conference standings and point differential since 1951

During the middle of last season, I started a weekly series devoted to non-conference games. Way back then, the 2014 West was on track for the highest winning percentage against the East over the last 18 years. They eventually fell just short of that mark, but recorded the highest point-differential against the East and vice versa. Those stats since 1997 are according to NBA.com, but there were still 46 years of non-conference matchups to uncover. Which conference in which year really had the highest winning percentage against the other? What about point differential? That’s what this post takes care of.

Below is a table allowing for sorting and filtering over the last 60+ years. 1951 to 1996 were from Basketball-Reference. After that I’ll look at the best years in winning percentage and point differential.

From 1951 to 1970, the conferences were called divisions and for good reason: There were as few as eight teams. The East was often the best over those 20 years of non-conference battles, and their peak was 1960. The Syracuse Nationals and Philadelphia Warriors improved by 10+ wins, the latter team with a rookie Wilt Chamberlain, but there was also the 59-16 Boston Celtics with Bill Russell. Out West, the St. Louis Hawks were the only team to finish over .500, 46-29, while the other three were a combined 74-151. The 1960 East still have the highest winning percentage ever in non-conference play at 70.83, 7.5 percent better than the 2004 West’s mark of 63.33, but they also own the highest point differential of +5.87, about a full point higher than the second-highest that came from the 1972 West.

More on those runner-ups in a bit. From 1951 to 1970, though, it seems fair to put an asterisk next to that era’s non-conference stats because of how small the NBA was. For that reason and visual purposes, I left them out of some charts.

As for 2004, the East was mostly a two-team race between the eventual champion Detroit Pistons and the conference finalist Indiana Pacers. In the West, the Lakers may have been the favorite, but there were arguably four other teams that, with a little luck, could’ve made the Finals instead. For the highest point differential, the 1972 West outdoes 2014 by a decent amount. Among other reasons for the West’s success 42 years ago, Kareem Abdul-Jabbar and the defending champion Milwaukee Bucks were in their second season placed in the conference. Six of their nine teams recorded over 47 wins that year while the East had just two of their eight do the same in Boston and New York.

Below is a chart of point differential since 1971 with some notes:

west pd since 1971

(click to enlarge)

Back to the table, though: I included ‘PD%’, which stands for point differential percentage. This was an attempt to adjust for pace over the years since the average in 1972 was 112.0 and last season it was 93.9. Maybe winning 125-115 looks less impressive than 105-95, maybe it doesn’t. When it comes to the top point differential, though, we can see if dividing West points by East points changes anything:

west pd and percentage since 1971 pdeahaiohaso;dhf

‘PD%’ doesn’t change too much of the top 10. It does lower the separation between the 1972 and 2014 West while some recent, slow-paced years with a dominant conference move up the ranks, but the charts over the last 40 years look pretty identical. They both indicate East was better during the ’80s and, when some guy named Michael Jordan wasn’t in retirement, the ’90s also. Since then, the East has struggled for a variety of reasons, one being sloppy roster management.

That looks to have changed somewhat, and sooner or later some of the West’s powerhouses will rebuild while the East will crank out more consistent winners. We’ll see how much LeBron James, Carmelo Anthony, and Chris Bosh all staying in the East helped the conference in both the short and long run.

Next Monday I’ll bounce off this post and take a look at non-conference records of the past using not just point differential, but some stats I’ve yet to use in this series. (Edit: Maybe not next Monday…but the next Monday after that, and also the Friday that week…!)

Looking at the NBA’s 2015 non-conference schedule

Last week’s release of the NBA’s 2014-15 season schedule marks the return of the non-conference posts. Maybe we’ll find something that gives one conference a scheduling edge over the other in their non-conference matchups. For the East, that would be nice.

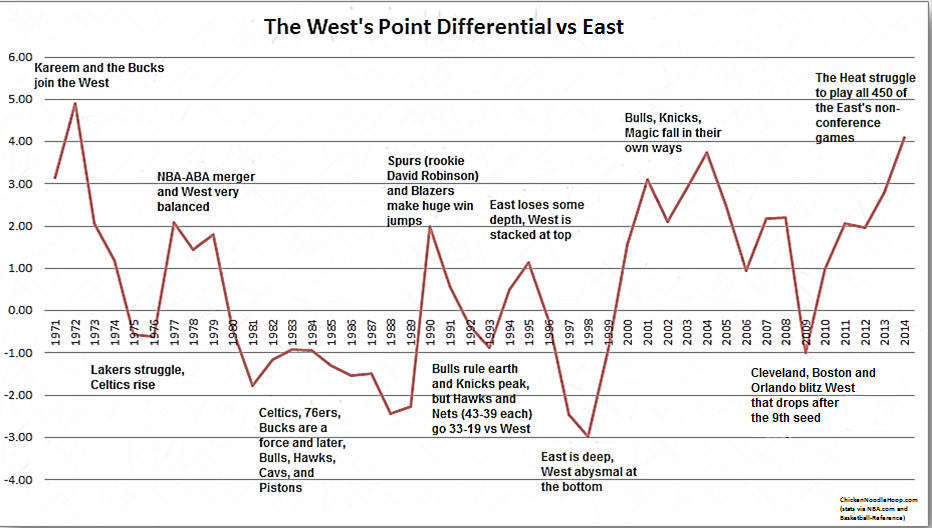
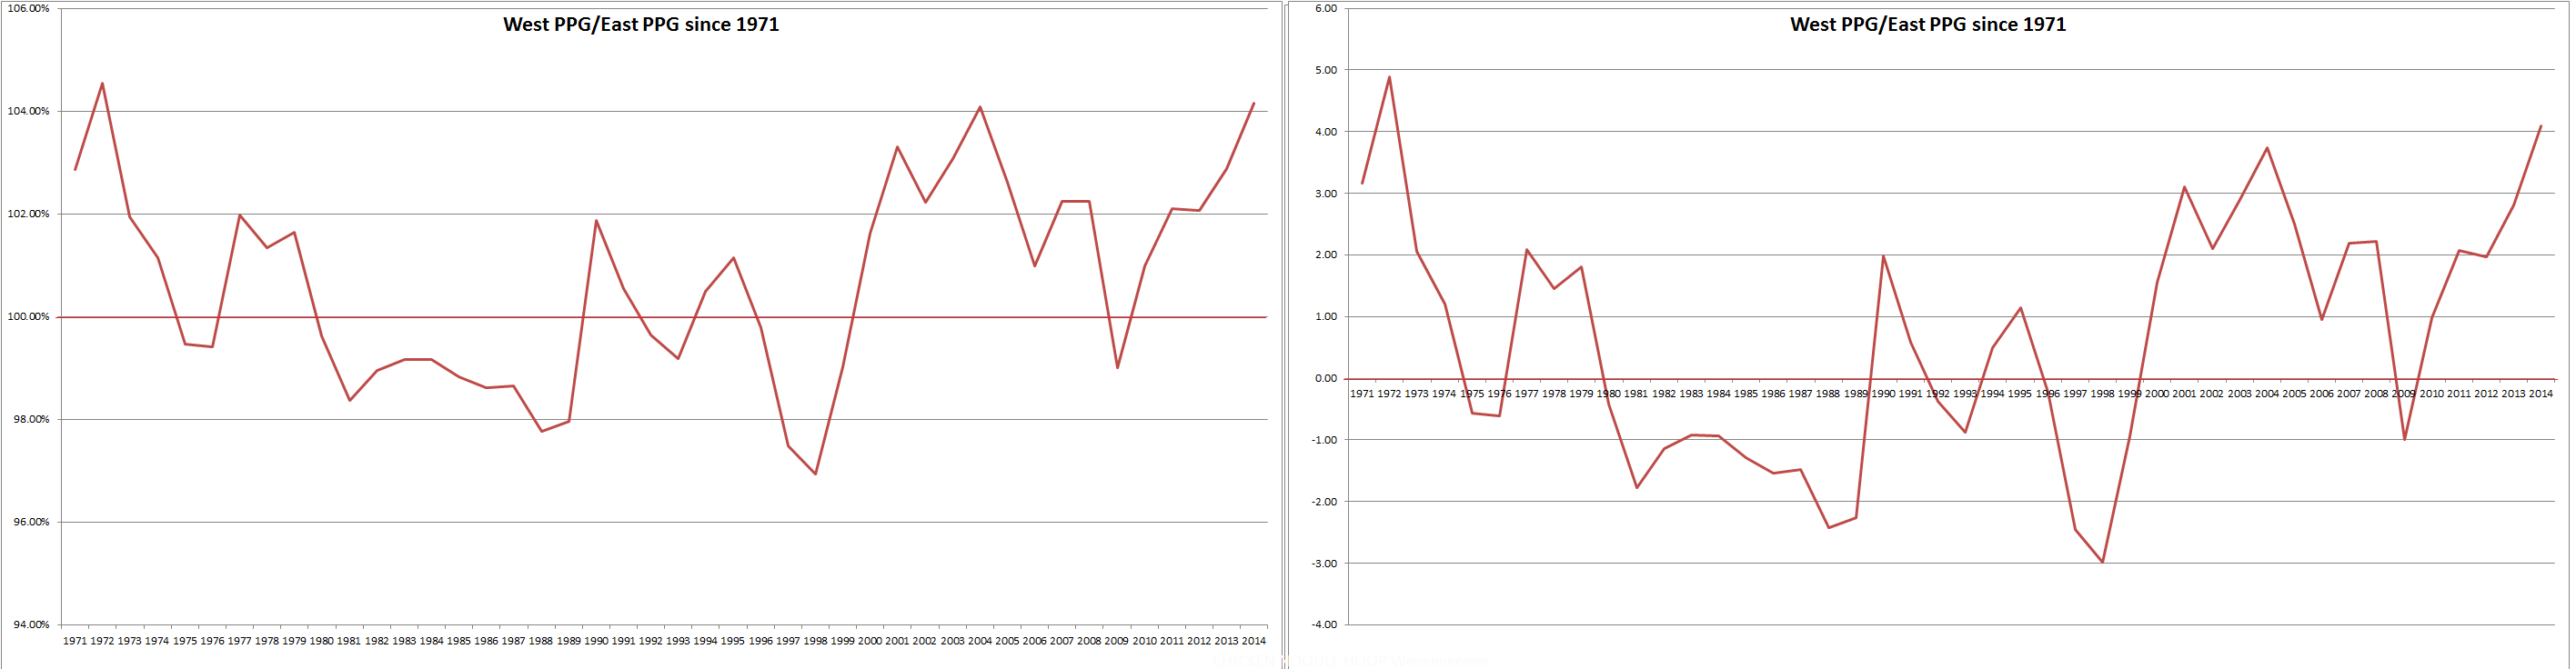
As a reminder, 450 non-conference games are played each season, basically taking the number of teams (30) divided by those in each conference (15). The matchups last season were historic in several ways, one being that the West outscored the East by 4.09 points per game, the highest ever point differential in the last 17 seasons, according to NBA.com. The 2014 West nearly finished with the highest winning percentage in non-conference play, but fell just short of the mark set in 2004 at 63.33 percent.

Below is a breakdown of point differential, wins and losses, and win percentage in non-conference play since 1998. You can find the same chart in the last East vs. West post last season. All stats are from NBA.com:

It’s probably obvious, but the 450 non-conference games next season are not scheduled at a consistent frequency over the season nor do they all take place within designated weeks. Below is a chart of how many of these games take place in each of the 25 weeks.

2015 non-conf games

19 of those 25 have anywhere from 14-29 non-conference games and the ones that fall below that range are opening week, the week just before and after the all-star break, and the last three weeks of the season. On the other end, weeks 5&6 (11/24-12/7), 13&14 (1/19-2/1), and 20&21 (3/9-3/22) combine to take up over a third of the non-conference games. Those two-week stretches feature 50, 51, and 56 games, respectively.

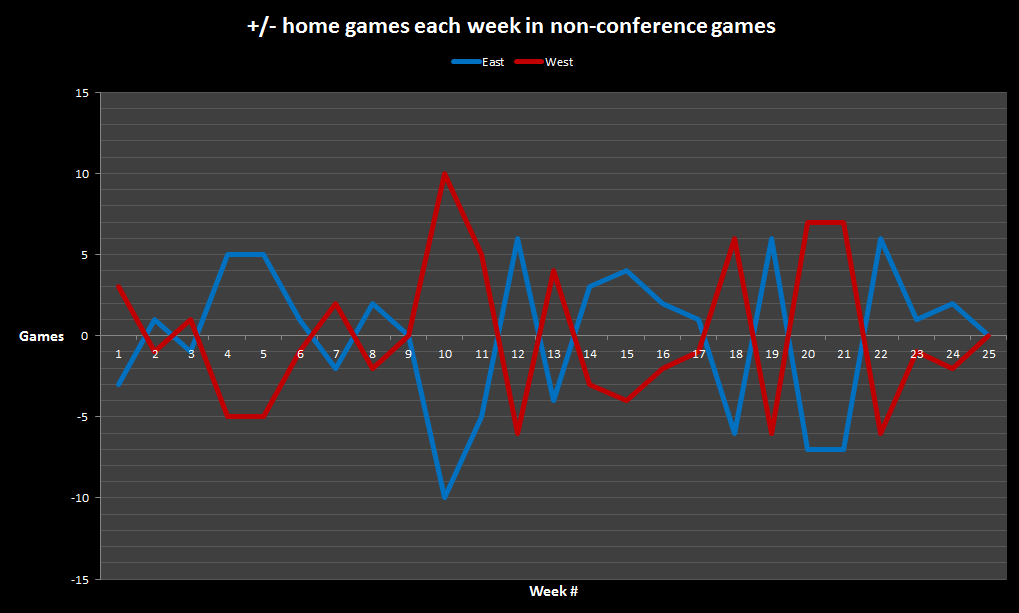
And though each team has 15 home and road non-conference games, they don’t happen equally either. Below is a chart looking at how many more home games each conference plays versus the other each week. For example, on the first week (10/28-11/2) the West has five home non-conference games versus two for the East, which amounts to +3 in the chart.

2015 non-conf home and road games

The East will have more home games early on, but it will catch up to them as we head into 2015 when the West will have 30 of the 45 games from 12/30 to 1/11 at home. From 1/26 to 2/22, the East will have 10 more home games than the West, but then the West hits another home-heavy stretch from 3/9 to 3/22.

Rest is also a factor in quite a few non-conference games. 238 (52.9 percent) of the 450 matchups will feature teams playing on equal days of rest, with 191 featuring both the West and East team on a one-day breather. Below is a chart of the total games on equal rest and those that feature rest advantages:

2015 non-conference rest


The advantage of playing games on more rest than an opponent goes to the East, 108 to the West’s 104, but the West holds arguably the most important rest advantage: Games with rest vs squads on back-to-backs, 69 games to 65 but also a 60 to 49 edge in games at home vs squads on a back-to-back. An advantage for the East is having six more games where they’ll have more rest vs opponents coming off a one-day break, best when an opponent is in the middle of a stretch of four games in five nights or three in four.

Of course, not all back-to-backs are equal. A back-to-back combo of Philadelphia and Boston is less intimidating than 2/3 of the Texas Triangle. Then again, the Knicks went 2-1 through the Spurs, Rockets, and Mavericks. Injuries and mid-season trades also happen, though the latter not nearly as often as in the past.

Predictions for teams and conferences is pointless to me, but I still see a top-5 point differential for the West with the reason as simple as the West remaining lo-o-o-oaded. That prediction isn’t as bold as saying the West will record their best ever winning percentage versus the East, but like last year a ton would have to go wrong for that to have a chance of happening. For the sake of a great season and competitive balance, hopefully Derrick Rose and the Bulls stay healthy, Toronto picks up where they left off since trading Rudy Gay, Chris Bosh returns to a strong #1 option, Cleveland has a hell of a year with LeBron James, Kevin Love, and Kyrie Irving, and the middle of the East wins a few more games than last season.

But we’re still over two months away from the regular season, which I struggle to accept. First hopeful thing comes first: Hopefully this off-season doesn’t last forever.

East vs. West Week 25: Final standings with offense-defense splits

The East vs. West series started thanks to the West’s usual dominance over the East this season, but also thanks to a post by Basketball-Reference detailing the historical disparity in the conferences over the years. This is the final post this season.

A bit late thanks to a fever that doesn’t seem to be letting up anytime soon and looking into a few projects going forward, but below is the final week-by-week non-conference breakdown. Followed by that are the final point differential tables and also some splits for how teams performed versus each conference and on the road or at home. There are some pretty glaring differences in each.

But below is the breakdown first:

The last game featured Detroit Detroiting to Oklahoma City, falling in the final minute to a Thunder squad looking to clinch the second seed out West.

Onto point differentials with the first sheet comparing this season’s margin of victory with others and the second sheet looking at month-by-month splits of this year.

Lastly, thanks to some boredom but also hoping to add something to the last of these posts, below are some home-road east-west splits for offensive efficiency, defensive efficiency, and net rating. Since I still can’t figure out how to let readers sort through columns (it might be available on the newest version of Google Sheets, but still no luck embedding those to here), I color-coated rankings:

Something of a TL;DR section for the tables above, starting with offensive efficiency and ending with net rating:

    • Sample sizes are somewhat small for each. There are 15 non-conference home and road games and 26 games each for teams in the same one, but especially for squads in the same division. It makes for some big swings when comparing splits, especially for a team that goes through a roller coaster of a regular season like, for example, a trip to the West coast while dealing with injuries or turmoil then hit its stride after hosting some games.
    • There’s a noticeable drop-off when comparing arguably the easiest games (at home versus a team out East) and arguably the most difficult (on the road versus a West squad). Comparing the former to the latter, New Orleans has the biggest decline in scoring, scoring 10.2 points/100 possessions less. Detroit, Milwaukee, and Cleveland have upticks, oddly enough.
    • When comparing those splits to a team’s overall offensive efficiency, here are the biggest increases and decreases: :
    • Uptick/Downtick compared to overall efficiency (offense)
      UpticksplitO downticksplitO
    • Like scoring for teams hosting East opponents compared to on the road against the West, the difference in allowing points per 100 possessions is pretty large. Again comparing the former to the latter, every team allowed more points on the road against West teams with Cleveland at the largest with +14.1 points.
    • For nearly the entire season, the Spurs were the only team to allow less than 100 points when on the road against the West, a spectacular feat when they rested their trio (and more) for a decent chunk of those games. That accomplishment disappeared after their games at Oklahoma City, Minnesota, Dallas, and Houston.
    • Below are the largest upticks and downticks in defensive efficiency when compared to a team’s overall numbers. Captain Obvious maybe, but here’s a reminder that downticks in defensive efficiency are good when regarding the screenshots below:
    • Uptick/Downtick compared to overall efficiency (defense)
      upticksplitDDownticksplitD
    • The last sheet, regarding net rating, features some more startling numbers. Indiana somehow has a negative net on the road against East teams while Minnesota, among others, has a quite a change when comparing games at home versus the East to any other split.
    • There’s also a 20 point/100 possession difference for New Orleans when comparing games at home versus the East and on the road against the West. It’s the highest difference when comparing those two splits. Indiana (16.1), Houston (13.7), Chicago (13.5), and Minnesota (13.0) round out the top five.
    • The Spurs and Clippers are among the more consistent teams when comparing each category.
    • Overall, this all confirms the obvious: Teams often performed much better against the East than the West and even more when adding home-road splits, though the sample sizes for each are somewhat small.

This was a fun series to fool around with each week, and it was nice to see these posts recently assist two of my favorite writers and tweeters, Zachary Bennett and Matt D’Anna, in looking at how to retool divisions and conferences, or even get rid of them. That probably did more for me than it did for them since it looks like this blog has a few extra readers daily, and it was nice to know there was at least some usefulness in these posts. Good stuff. I definitely celebrated with a ham sandwich. It was fantastic.

But that’s it for this series, at least until next season when I could see the West pulling off a top-5 point differential. There are some likely rising teams out East like Washington, Toronto, and Chicago in a way, among others, but the West has as many if not more teams that should improve like Phoenix, New Orleans, and possibly the Lakers and ones that should stay legitimate in Oklahoma City, Houston, and the Clippers. Of course, there’s a whole off-season to play out and the East could balance itself somewhat with teams rising from the lottery to 40-win territory, but for now I’m siding with yet another loaded Western Conference.

East vs. West Week 24: Eh???

Updated week-by-week breakdown with an added column: point differential for the West through each week.

The one game left is Detroit taking on Oklahoma City on Wednesday, guaranteed (probably) to be fun for no longer than one half.

With Oklahoma City’s loss at Indiana yesterday, though, the West is out of contention for their highest winning percentage ever. Sad times since I beat that possibility into the ground over the last two months. Regardless, there’s always point differential to look at:

Lastly, updated month-by-month point differential:

I’ll look into posting something far more interesting after the regular season concludes. We’re so close to those amazing first round matchups out West andacoupleoutEastbutwhatever. Three more days!