Stabs at Westgate SuperBook’s 2015-16 over/unders

Since Westgate’s over-unders have been tweeted out, it’s time for an immediate blog post. I guess this will be a yearly thing since I did this over 360 days ago, back when I sarcastically predicted Golden State would win 70 games if Harrison Barnes started over Andre Iguodala, and Marreese Speights started became a stretch four. GEN.IUS. Well, this season I have one more weird prediction for Golden State and 29 others, but not really. There were some over-unders I didn’t really know what to go with, so like last year I let blog momentum and other factors decide some for me.

For whatever it’s worth, I went 17-13 for the 2014-15 season, which means I’m better than 17 out of every 30 NBA players. That’s how this works. We’ll have to wait and see if I got better over this off-season or not, or something. What am I talkiing about.

Advertisement

Chris Webber’s Hockey and Free Throw Assists (Updated)

34

Last summer I wrote a shooting profile of Chris Webber at Nylon Calculus and later posted some of his passing stats here. During all-star weekend, I added to the latter but never updated the post. With the Lowe Post podcasts featuring Howard Beck and Shane Battier mentioning Webber and those early-2000s Kings, now would be good to, like, post those updated numbers instead of letting them sit in a folder. I also spent some free time adding a few more games, random thoughts, and GIFs. Webber’s best years are very good GIF material.

Below are the updated numbers. 2ary means secondary/hockey assists. It’s the same stuff found in player tracking statistics over the last two seasons:

web
Random Thoughts

  • Like 90 percent of the regular season games I watched weren’t in English, but that’s okay. There were a couple YouTube accounts with a TON of sports games from overseas and just so happened to have random Kings-Wizards, Kings-Clippers games. Maybe Sacramento really did have worldwide appeal?
  • This is still a small sample of games, less than 10 percent of Webber’s from 1999 to 2003 (added two 1997 games anyway). It would be nice to get more regular season totals, and maybe that’ll happen with how many random games pop up over each off-season.
  • The hockey assists are a little underwhelming, in my opinion, but as a team I feel like there’s no doubt the Kings would’ve crushed in this stat. Same with the late-90s Sonics teams, among others.
  • I may have been too picky on free throw assists, but I don’t remember if at first I gave them only to shooting fouls. If that’s what I was doing, Webber’s real free throw assist totals would get a nice boost considering how often he would use his behind-the-back pass to find a cutter near the rim.
    • Those passes definitely did not always work, by the way, but the payoff in the long run was greater than the occasional turnover. How exactly do you guard those, the normal passing angles and Webber’s scoring?
  • There were so many handoffs around the elbow to post-Magic Nick Anderson, one of a few players from 1999 to 2001 who I think are easy to forget. Maybe there wouldn’t be much of an assist difference since overall there isn’t much of one, but Anderson getting those handoffs around the arc instead of an older Peja Stojakovic, Hedo Turkoglu, or Mike Bibby…I don’t know. I should’ve tracked the assist opportunity field goal percentage on strickly jumpers.
  • Once Webber became a ~50 percent shooter from the elbows, those handoffs seemed like a low-key nightmare to guard. He was, um, clever enough to fake them for shots and attack cheating defenders off the dribble, but a reliable jumper was another effective option as a safety valve for whoever was running off him.
  • In terms of rivalries, from a distance it seems like the Kings’ were obviously the Lakers, but also the Jazz and Mavericks given the frequency of their playoff matchups. I remember from 2001 to 2004 they had some ridiculous games against the Timberwolves, too. 2004 was crazy. I got chills before Game 1 of the semifinals just from how much respect I had for the Kings. Not exactly the same feeling whenever the Timberwolves played the Lakers or Spurs…
    • For all the offense involved, the few Mavericks-Kings games I watched with or without Webber were a lot more physical and intense (Mavs fans and THEIR cowbells!) than I expected. Nothing like seeing these two play in the second round. The damn West.
  • For somebody of Webber’s value, he committed some really, really bad fouls. He also got away with some, such as a reach on Robert Horry in the final minutes of Game 6 in 2002. If that was called? Yikes. I love Webber’s offense and will defend his efficiency, but I also might be too harsh on his defense and rebounding.
  • It’s kind of jarring how different Webber was after his knee injury. Did this stage of his career really happen? His stint with Philadelphia in 2005, given his minutes per game, is probably one of 100 worst >500-minute stints/seasons in league history.
    • What other modern day guys would make the cut? 2004 Antoine Walker and 2013 Kevin Love? So much Sasha Pavlovic, too.
      • These random thoughts are getting really mean.
  • One of several fascinating statistics over Webber’s career: 2005-06 season, he was 32 years old and two years after knee surgery, but played 75 games and nearly 39 minutes per for his career high in season minutes.
  • Okay that’s it, enjoy some GIFs! Some may be potatoes, though.
    • Also, if you’re on a phone, beware: They’re on auto-play, and probably load slow at first because of that.

29

I thought that was a low-key amazing pass.

And then a few GIFs from the fourth quarter of Game 4 of the 2000 playoffs:

26

27

28

That was a really fantastic quarter.

Some other potatoes:

30

That might’ve been what made Webber unlikeable. 17-point lead with ~16 minutes to go and doing a little showboating, but these two teams played a pretty physical game a week prior and that was Webber’s former team. REVENGE OR SOMETHING.

33

That was literally the first possession of the game.

22

31

Fun times. Now, time to get all set for the 2015-16 season. Hope you all are, too.

Half-Court Heaving Vs. Pitchers Hitting

😐 😐 😐 😐 😐 😐 😐 😐 😐 😐 😐 😐 😐 😐 😐 😐 😐 😐 😐 😐 😐 😐 😐 😐 😐 😐 😐

If you’re a first-time visitor of this blog or new to my work in general, just know I track some random, possibly pointless statistics, and one of them involves shots from beyond half-court. Also, most of my posts here are just me forcing myself to write to stay in the routine. This is what happens when I combine the pointless stats and forcing myself to write while it’s the off-season.

I compared shots from beyond half-court with batting statistics from pitchers.

The goal was to find a hitting statistic, preferably a positive outcome, that had about the same percentage of happening as a 45+ foot shot going into the basket, and the simplest way for me to do that was to start by looking at pitchers, the worst hitters in baseball. 45 feet isn’t half-court, by the way, but it’s a two-foot cushion I like to give after Casper Ware made a heave in 2014.

With that in mind, a more recent post on half-court shots showed that the average accuracy from 2001 to 2015 was 2.55 percent. Huge, but justtttt a bit lower than a pitcher’s batting average from 2001 to Wednesday night:

hv1

Micah Owings leads all pitchers in batting average, minimum 100 plate appearances, with a .283 mark. 100 plate appearances is the filter I decided on, fair or not or whatever.

On-base percentage would be hopeless to compare now. Maybe walk percentage?

hv2

Much closer, pitchers walking are 10.4 times less likely than a strikeout but not high enough to be compared to made heaves. That’s even if we took out all two of the intentional walks by Chris Hatcher and Brooks Kieschnick. Kevin Jarvis is the current leader in walk rate at 9.6 percent.

What about plate appearance ending with a hit by a pitch?

hv3

Too low now. Kevin Brown got hit in 2.2 percent of his plate appearances, three total. Roy Oswalt leads with five HBPs, but okay, maybe it’s time to screw around here.

Stolen base attempts for every single or walk?

hv4

Okay, that was closer, but making that stat up felt really dumb. Greg Maddux had seven stolen bases, though, so there’s that.

Pitchers bunt way more often than they would move a runner with a fly ball in the outfield. What’s the sacrifice fly to hit percentage?

hv5

EVEN CLOSER, but still a weirdo stat. What about trying extra-base hit percentage, because surely when pitchers get a hit it’s just a blooper or whatever.

hv7

Welp, might as well start all over. Carlos Zambrano had 24 home runs and 53 total extra-base hits in his career, the most, as you might have noticed, since 2001. 32 percent of his hits were doubles, triples, or home runs, but Manny Parra had the highest percentage of hits go for extra bases at 44.4 percent.

What about extra base hits per plate appearance?

hv6

XBH* Whatever

I don’t follow baseball closely, but not only are these percentages close enough to each other, the outcome we just compared to NBA heaves makes enough sense to be the baseball version, right? Maybe this outcome would be way too high, though, if pitchers were told to swing away more often than move runners along. Regardless, Owings, also the leader in batting average, takes the cake here with 11.4 percent of his plate appearances leading to extra base hits.

I suppose I could’ve filtered this to see pitching numbers from the seventh inning on, or whenever a pinch hitter becomes logical, but I don’t want to look this up and I don’t know how to. However, in an effort to spread heave awareness (STOP RUNNING THE CLOCK OUT TO PRESERVE YOUR BASIC STATS WE LOOK PAST ANYWAY BECAUSE THERE ARE TONS OF DIFFERENT WAYS WE CAN SEPARATE THESE LOW PERCENTAGE SHOTS OR ANY OTHER KIND OF SHOT FROM THE REST) just remember that over the last 15 years, the chances of making a shot from 45+ feet in the NBA has been about as likely as a pitcher stepping up to the plate and hitting a double, triple, or home run.

Now you know. So now when a pitcher is up to bat, you should also think of heaves.

Stay tuned more attempts to reach “peak off-season”, but for your safety you probably shouldn’t.

Statistics were from Basketball-Reference and FanGraphs. I love you both.

The NBA’s All-Bizarro Leaders in Minutes

The dead stage of the off-season is here.

This might be a hot take, but the best and/or most irreplaceable players should be on the floor as much as possible. That doesn’t always happen, though, and a season usually ends with more than a few teams with unexpected leaders in total minutes. Injuries pick apart the top of some rosters, other teams rebuild with somebody having to be a key cog, and some aging players continue to play a major role on the floor. Other weird things happen over 82 games that lead to some larger-than-expected minute totals, but those are three simple reasons for it.

So since it’s the off-season, why not make a five-player squad comprised of the most unusual minutes leaders? A while back, I actually tweeted my five bizarro minute leaders from last season, but I made an adjustment while putting this post together. Despite a center, Marc Gasol was an understandable leader in minutes for Memphis. He’s pretty good and stuff. A key component to being good at the NBA level is having basketball skills, and Gasol has them, or it. He has it.

Replacing Gasol was a Sacramento King not named DeMarcus Cousins or Rudy Gay, but still a decent player. Most of the guys were fine players who happened to log like 1,000 too many minutes for their team, usually a mediocre to bad one. 2014-2015’s bizarro minute leaders:

2015 Tm MIN G MPG
Shane Larkin NYK 1,865 76 24.5
Ben McLemore SAC 2,670 82 32.6
Solomon Hill IND 2,381 82 29.0
Wes Johnson LAL 2,245 76 29.5
Pau Gasol CHI 2,681 78 34.4

Larkin, McLemore, and Johnson were on teams retooling either in the summer or mid-season, Hill played over 10 times as many minutes as he did in 2014 thanks mostly to Paul George‘s freak leg injury, and Pau Gasol logged over 2,500 minutes for the first time since 2011. Things happened.

That’s as realistic of a starting five when it comes to picking weirdo minutes leaders. For the heck of it, I did the same exercise back to the 2006-07 season. I found most of these players to be truly interesting, but I figured some players like Khris Middleton would be strange only to those who weren’t all that aware of him yet.

2014 TM MIN G MPG
Randy Foye DEN 2,485 81 30.7
Jodie Meeks LAL 2,556 77 33.2
Khris Middleton MIL 2,460 82 30.0
Jeff Green BOS 2,805 82 34.2
Tristan Thompson CLE 2,594 82 31.6
2013 TM MIN G MPG
Luke Ridnour MIN 2,474 82 30.2
Greivis Vasquez NOH 2,685 78 34.4
J.R. Smith NYK 2,678 80 33.5
Martell Webster WAS 2,200 76 28.9
Tristan Thompson CLE 2,564 82 31.3
2012 TM MIN G MPG
Brandon Knight DET 2,129 66 32.3
Marco Belinelli NOH 1,966 66 29.8
Luis Scola HOU 2,067 66 31.3
Antawn Jamison CLE 2,151 65 33.1
Kris Humphries NJN 2,162 62 34.9
2011 TM MIN G MPG
Jason Kidd DAL 2,653 80 33.2
Beno Udrih SAC 2,734 79 34.6
John Salmons MIL 2,554 73 35.0
Boris Diaw CHA 2,778 82 33.9
J.J. Hickson CLE 2,256 80 28.2
2010 TM MIN G MPG
Andre Miller POR 2,500 82 30.5
Corey Brewer MIN 2,482 82 30.3
Rasual Butler LAC 2,702 82 33.0
Andre Bargnani TOR 2,799 80 35.0
Andray Blatche WAS 2,256 81 27.9
2009 TM MIN G MPG
Chris Duhon NYK 2,906 79 36.8
Jarrett Jack IND 2,716 82 33.1
Kelenna Azubuike GSW 2,375 74 32.1
Ronnie Brewer UTA 2,605 81 32.2
Ryan Gomes MIN 2,494 82 30.4
2008 TM MIN G MPG
Jamal Crawford NYK 3,190 80 39.9
Cuttino Mobley LAC 2,702 77 35.1
Ricky Davis MIA 2,963 82 36.1
Anthony Parker TOR 2,634 82 32.1
John Salmons SAC 2,517 81 31.1
2007 TM MIN G MPG
Ricky Davis MIN 3,021 81 37.3
Charlie Bell MIL 2,848 82 34.7
Desmond Mason NOK 2,575 75 34.3
Chris Wilcox SEA 2,586 82 31.5
Eddy Curry NYK 2,849 81 35.2

Random note: If you’ve ever fiddled with the simulations at WhatIfSports, the players in the seasons listed above are a bit pricey because of their minute totals and are some of the worst minute-per-dollar versions of themselves. That’s a solid site to kill time during the off-season, by the way. Their basketball simulation isn’t perfect, but it’s fun.

That was nine total squads, though. 2005-06 minutes leaders weren’t all that interesting, but we can get to a perfect round number by throwing out possible names to make the 2015-16 squad:

  • Roughly 95 percent of the players in the Atlantic Division.
  • Enes Kanter.
  • Meyers Leonard please, please, please, but Damian Lillard is just a bit more likely.
  • Zaza Pachulia or Wes Matthews.
  • Andrew Wiggins if he plays like 3,500 minutes.
  • Kobe Bryant, just because of age and stuff.
  • Rajon Rondo, a mediocre NBA player for a mediocre blog.

There were probably a few players I forgot, because of course.

All statistics were from Basketball-Reference. I love you.

Looking at the Timberwolves During the Free agent Frenzy

As we near 48 hours of staring at Twitter for the latest updates in free agency, the Timberwolves are one of the few teams yet to steal the spotlight. Sure, Karl-Anthony Towns and Tyus Jones will eventually sign their rookie-scaled contracts and Nemanja Bjelica may agree to a multi-year contract. Those would generate some fireworks, but Minnesota already held the rights to those players, and they already have 10 guaranteed contracts. Kevin Garnett will also resign re-sign, and Robbie Hummel looks to be coming back as well. There are still minor splashes that can be made, but the Timberwolves already have their core in place.

That doesn’t mean we can’t take a thing or two away from what’s already happened across the league and apply it to the Timberwolves, though. Some of it may be repetitive as we’ve learned just how much money is being thrown around because of the rising cap after the 2015-16 season. Those two changes to the NBA landscape were mentioned often in what I wrote below, but let’s take a look at how they affect the Timberwolves anyway:

The Long-Term Contracts

Minnesota’s two largest annual salaries currently take up over a third of the salary cap, but by 2018 that would be down to nearly 20 percent. Ricky Rubio holds the Timberwolves’ largest contract guarantee, and his four-year, $55 million contract starts now. As with most major contracts, the reaction to his on Twitter was polarizing, but it looks better after last night regardless. At this point, the biggest worry is Rubio’s health, but that’s more because of the length of his contract than his injury history so long as Flip doesn’t run him into the ground. I’m weirdly not too worried about that.

The much larger worry comes from Nikola Pekovic. $35.8 million for three years is a lot to absorb from a player who may never crack 1,000 minutes in any of those seasons due to chronic ankle issues and an Achilles debridement, but Pekovic’s contract looks a bit better now that the quality in players above or around eight figures got a little worse after last night. The year total on Pekovic’s contract remains bad, though, and an asset would still have to be attached or a smaller, troubling contract would have to be taken back in a trade.

Rebuilding without sacrificing some of the future is important. We’ll see if Minnesota can do that while handling Pekovic’s contract. At this point, a reasonably healthy, effective 2015-16 campaign would take some of the load off the frontline while making him more tradeable. $23.7 million for two years looks better than $35.8 million for three. With room to maneuver going forward and how far Minnesota is from the playoffs, I’m not sure moving Pekovic is necessary anyway. Just eat the contract if nothing on the trade market is attractive.

The Rookie Contracts

If no rookie contracts are traded, the Timberwolves will be paying less than $30 million to Karl-Anthony Towns, Tyus Jones, Andrew Wiggins, Zach LaVine, Adreian Payne, Anthony Bennett, Shabazz Muhammad, and Gorgui Dieng, as well as the choice to keep them all for the 2016-17 season for a slightly higher price. That was already important before free agency, but it’s even more crucial now that we’re past July 1, though they have a lot of players to develop.

Minnesota will have to eventually address the second contracts of the youthful bunch, but a good chunk of money will be off the books by then. Looking ahead to the summer of 2016 isn’t that helpful given what could happen by then, but Kevin Martin and Chase Budinger will either hit free agency or have been traded, and among team options Bennett’s $7.3 million for 2016-17 is still up in the air. That’s about $20 million possibly off the books going into 2016-17 when Muhammad, Dieng, and Bennett will be the first rookies to come off their first contract.

Who knows how much of that money is really going to be thrown at Muhammad and Dieng if they’re still around. (I’m assuming Bennett’s gone.) Muhammad’s such a fascinating player as a possible small ball power forward, but he’s yet to play a full season. Dieng’s played a more meaningful role up to this point, but will be 28 years old in 2017-18, the first season of his second contract (same for Payne when that time arrives).

That’s down the road, though. Right now, Minnesota is down two protected first-round picks to dangle, but they get to enjoy having most of their core on the cheap with team options. Not bad for a rebuilding team.

The In-Between Contracts

How about the roller coaster that is Kevin Martin’s contract? In the summer of 2013, Martin was 30 years old with injury history, and his value on the court was noticeably impacted by the change in the rip-through move, but four years and $28 million was still perfectly understandable. The Timberwolves had to build a playoff contender around Kevin Love and, with Martin, looked to be one of the most efficient offenses.

Well, the gamble didn’t pay off. The Wolves missed out on the postseason and Love was traded. Another rebuild was on the horizon, though not quite at the level of just 16 wins, and Martin was due $7 million per year up to 2017. So. Much. WELP. Fortunately, Martin’s contract looks a lot better now. Even if he’s not able to be traded or if Flip Saunders just doesn’t want to make a move, the $7 million player option for 2016-17 shouldn’t be exercised with how much players are making on the open market.

Normally I’d prefer aging players to play for playoff contenders, but Minnesota could use a guy who can soak up scoring possessions. That’s a brutal process to watch when it comes to Martin, but Wiggins could learn a thing or two from his foul-drawing, among other scoring-and-definitely-not-defensive things.

The idea of Chase Budinger is better than actual Chase Budinger. How much would he have made if his first four years were from 2013 to 2016 rather than 2010 to 2013? Budinger’s a free agent after this season’s $5 million owed, but this team is weirdly deep and I’m not sure how many minutes are there for him.

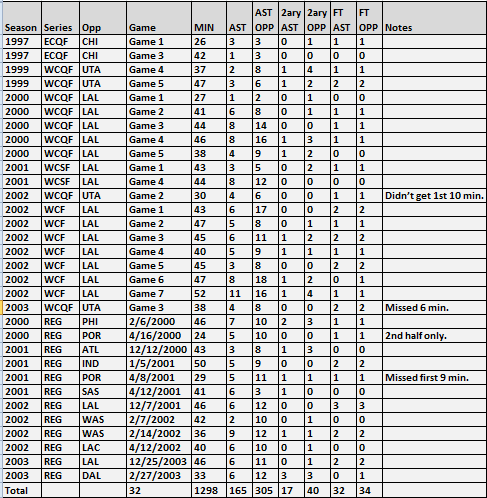
There’s also Garnett and whatever he resigns re-signs for. By the way, Anthony Davis’ five-year, $145 million contract has nothing on what KG signed for during the 1997-98 season:

One day the Timberwolves may find themselves in a similar position with Wiggins, Towns, and/or maybe they’ll spread money around multiple players on the market. Cap space allows for a ton of possibilities as we’ve seen over the last 48 hours, though sometimes that does not end well. The draft and free agency each carry risk, and right now Minnesota has done well in the former. They’re currently on the sidelines when it comes to the latter, but with how decent their contracts look outside of Pekovic they’ll eventually have the chance to make some major moves of their own.

%d bloggers like this: