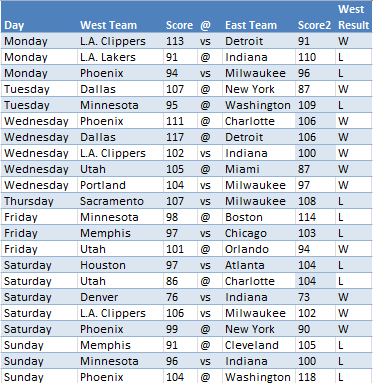
Week 8 was another close call for the West, finishing .500 at 11-11 and continuing their possibly never-ending streak of finishing weeks at that mark or better. However, it was the first week the West recorded a negative point differential (only -0.18, but still). I think Atlanta’s victory over Houston was the most impressive Week 8 game for the East, but take a look at the scores for yourself and the non-conference summary below.
Seems like the West is cooling off, and with about one-third of non-conference games already concluded, I looked at how this year’s stats measure up against those since 1971. I chose that year as the cutoff since conferences were called divisions before that, and it’s also the cutoff I used in posts like this one.
Stats I looked at were:
- Point Differential: This is where 2014 separated itself from previous seasons.
- West PPG/East PPG: This kind of adjusts for high and low scoring games. A 70-60 victory may or may not be more dominant than 130-120.
- Win Percentage
- Pythagorean Win Difference: The West’s real record is better than their Pyth one. How unusual is this?
- Pythagorean Win% Difference
In the future, I’ll look at different stats instead of repeating myself over and over.
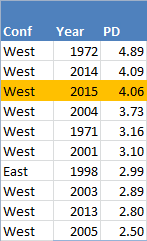
So the West currently holds a point differential of +4.06, just short of 2014’s mark but still more than good enough to make the top 10:
Ew, vertical screenshots (there’s a lot of them in this post)
As noted in some other posts, 1972 just wasn’t fair. Milwaukee, with Kareem Abdul-Jabbar and Oscar Robertson, were new to the Western Conference and it kind of sort of had a huge impact on non-conference statistics. For 2015, there are still about two-thirds of the non-conference schedule to play out, so there’s plenty of room for the West to either pad their point differential or for the East to continue putting a dent into it like they have over the last two weeks.
Also, long live the 1998 East!
Adjusting for high and low-scoring seasons, I also divided the West points by East points and vice versa to find the 10 highest percentages:

2014 and 2015 are more close to 1972 according to PD%, and 2015 is oh so close to the best of the last 15 seasons. Kind of crazy that seven seasons since 2000 make the top 10.
When it comes to win percentage, though, 2015 takes the cake. At least so far:

2014 was so close to topping the list before falling just short. I guess we’ll see if the 2015 West continues fizzling or comes back strong over the next four months (yes, there are still about four months to go).
When looking at how the West’s real win percentage stacks up against their Pythagorean one, 2015 isn’t too unique. According to point differential, the West has performed 1.8 wins better than expected, which is just above average when applying that amount for every ~150 games. From 1971 to 2014 (not including 1999), the average win difference is 4.8.
The difference in win percentage isn’t anything special either, and I’m not sure but maybe it’s a better measurement right now? The West’s real win% is 1.13 percent better than their Pythagorean one, and the average is about 1.33.
Below is look at the top 10 win% and win differences:


I suppose it’s worth diving into whether or not the West has had a cake non-conference schedule so far, or not, and has been either taking advantage of an easy schedule or performing strong against a, well, stronger-than-average non-conference schedule (edit: Easy schedule meaning rest advantages, etc.). Maybe in Week 9’s roundup I’ll look into that, and some other things. Maybe.
Below are the non-conference games this week, a smaller slate thanks to the holidays:

Enjoy the week! Maybe this is the one where the East goes over .500 for the first time. In the meantime, I’ll be ordering some holiday ham off Amazon.
Tagged: Atlanta Hawks, Eastern Conference, Houston Rockets, Kareem Abdul-Jabbar, Oscar Robertson, Western Conference

[…] you missed Week 8’s summary, I also compared this season’s non-conference numbers with the last 44 seasons. Turns out the […]