East vs. West Week 9: The East finally breaks through

After six weeks of embarrassment and two of mediocrity, the East finally had a breakthrough week in non-conference play, finishing Week 9 10-6. Time for the occasional celebration with a ham sandwich.

Toronto, Atlanta, and Chicago cleaned up for the East while New York, well, no. Just, no. For the West, the Clippers and Nuggets struggled in their multiple non-conference games while Portland took care of business against New York and Philadelphia. Not sure which team is better than the other, but kind of want to lean towards the Sixers.

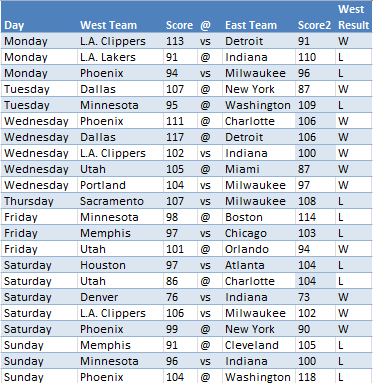
Anyway, catch up on Week 9 and every other week if you’d like. Below is the week-by-week breakdown and the rest of the latest batch of non-conference scores.

week9

Experimenting with table formatting, if you didn’t notice already.

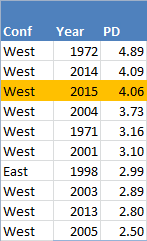
If you missed Week 8’s summary, I also compared this season’s non-conference numbers with the last 44 seasons. Turns out the West had a record-breaking win percentage, along with the third-best point differential. After Week 9, though, those numbers obviously took a hit and the win percentage is no longer the best mark ever.

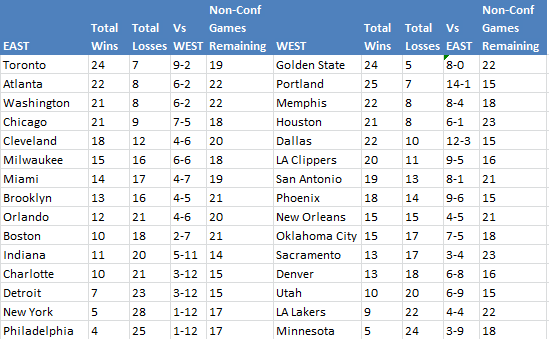
It could get worse as the better teams of the East start playing more of the non-conference games. Below is a look at the amount of remaining matchups for every team in both conferences.

gamsasdasda

For the West, it’s somewhat balanced between how many of the East-West games have been played by the better or worse teams of their conference. Meanwhile, there’s been a problem in the East. Charlotte and Detroit are already halfway through their West schedule while Atlanta and Washington are only about a third of the way through theirs. The East has five niiiiice teams plus a feisty Milwaukee, but they’ve all played less games against the West than the bottom five in their respective conference.

Which brings us to Week 10. There are 22 non-conference matchups with Atlanta, Toronto, and Washington playing in 10 of them. The West will have a 16-6 home-road edge, though, as that’s one advantage the East had early on in the season, one that will vanish over this week and next.

Below is a look at the full schedule:

week10games

Enjoy the week. Curious how Week 10 ends up for the East. Things are starting to change in their favor, but I also need to dig a little deeper to confirm this, me thinks.


East vs. West Week 8: So close, and how this season stacks up with the last 44

Week 8 was another close call for the West, finishing .500 at 11-11 and continuing their possibly never-ending streak of finishing weeks at that mark or better. However, it was the first week the West recorded a negative point differential (only -0.18, but still). I think Atlanta’s victory over Houston was the most impressive Week 8 game for the East, but take a look at the scores for yourself and the non-conference summary below.

week8asa

Seems like the West is cooling off, and with about one-third of non-conference games already concluded, I looked at how this year’s stats measure up against those since 1971. I chose that year as the cutoff since conferences were called divisions before that, and it’s also the cutoff I used in posts like this one.

Stats I looked at were:

  • Point Differential: This is where 2014 separated itself from previous seasons.
  • West PPG/East PPG: This kind of adjusts for high and low scoring games. A 70-60 victory may or may not be more dominant than 130-120.
  • Win Percentage
  • Pythagorean Win Difference: The West’s real record is better than their Pyth one. How unusual is this?
  • Pythagorean Win% Difference

In the future, I’ll look at different stats instead of repeating myself over and over.

So the West currently holds a point differential of +4.06, just short of 2014’s mark but still more than good enough to make the top 10:

pd

Ew, vertical screenshots (there’s a lot of them in this post)

As noted in some other posts, 1972 just wasn’t fair. Milwaukee, with Kareem Abdul-Jabbar and Oscar Robertson, were new to the Western Conference and it kind of sort of had a huge impact on non-conference statistics. For 2015, there are still about two-thirds of the non-conference schedule to play out, so there’s plenty of room for the West to either pad their point differential or for the East to continue putting a dent into it like they have over the last two weeks.

Also, long live the 1998 East!

Adjusting for high and low-scoring seasons, I also divided the West points by East points and vice versa to find the 10 highest percentages:

pdperc

2014 and 2015 are more close to 1972 according to PD%, and 2015 is oh so close to the best of the last 15 seasons. Kind of crazy that seven seasons since 2000 make the top 10.

When it comes to win percentage, though, 2015 takes the cake. At least so far:

winpe

2014 was so close to topping the list before falling just short. I guess we’ll see if the 2015 West continues fizzling or comes back strong over the next four months (yes, there are still about four months to go).

When looking at how the West’s real win percentage stacks up against their Pythagorean one, 2015 isn’t too unique. According to point differential, the West has performed 1.8 wins better than expected, which is just above average when applying that amount for every ~150 games. From 1971 to 2014 (not including 1999), the average win difference is 4.8.

The difference in win percentage isn’t anything special either, and I’m not sure but maybe it’s a better measurement right now? The West’s real win% is 1.13 percent better than their Pythagorean one, and the average is about 1.33.

Below is look at the top 10 win% and win differences:

winperiffwestdiffsfsf

I suppose it’s worth diving into whether or not the West has had a cake non-conference schedule so far, or not, and has been either taking advantage of an easy schedule or performing strong against a, well, stronger-than-average non-conference schedule (edit: Easy schedule meaning rest advantages, etc.). Maybe in Week 9’s roundup I’ll look into that, and some other things. Maybe.

Below are the non-conference games this week, a smaller slate thanks to the holidays:

week9games

Enjoy the week! Maybe this is the one where the East goes over .500 for the first time. In the meantime, I’ll be ordering some holiday ham off Amazon.

East vs. West Week 7: West with another winning week, but barely

A day late because, I don’t know really. Kind of ridiculous when this series is usually my only contribution to my own blog each week.

Week 7 wasn’t too bad for the East, finishing, um, 9-11, which makes for the seventh straight week the West finished with a winning record, but the East was decent! This was mostly thanks to a strong weekend, including a near-upset of Philadelphia over Memphis. Below is a look at the week-by-week summary and scores from last week:

week 7 scores

Lots of Clippers, Jazz, Suns, and Timberwolves in Week 8, playing in 13 of the 22 non-conference games. For the East, Indiana and Milwaukee are in four games each. Both played in one last night. FUN STUFF.

A quick screenshot of Week 8 with scores from Monday:

week8

So after this week there will be over 150 non-conference games. Will try to make next week a bit more interesting now that there’s a decent sample of games already played.


The best, worst, most even, and most lopsided matchups by SRS

As noted in my previous post, we’re about 1/4th of the way through the NBA season. There’s very little time to reflect, however, as there are 10 games scheduled tonight. There are a couple nice matchups in Pelicans-Mavericks and Rockets-Warriors, some lopsided ones in Knicks-Spurs and Clippers-Pacers, and finally some in-between, perfectly mediocre games in Celtics-Hornets and Heat-Nuggets. WHAT A GREAT NIGHT.

I actually looked at which games applied to each of those categories over the first fourth of the season, measuring them by Basketball-Reference’s metric labeled SRS, or Simple Rating System. SRS takes into account a team’s point differential and strength of schedule. It is not a perfect metric, ignoring wins and losses as I’ve explained here, but to me it’s better than looking strictly at margin of victory, among other statistics. For reference, the Golden State Warriors currently have the best SRS at 9.54 while the 76ers have the league-worst at -11.89. Anything above, say, 5.00 is very good.

I like the metric, so I’ve kept track of every team’s SRS on game nights. The first couple weeks were cut out from this post, though, because SRS needs to even itself out over the first handful of games or so. We will always have the -22.20 from New York and +25.46 from Golden State on November 2.

Below have been the 10 best matchups so far, sorted by the sum of the SRS from both teams:

best 10

There are some expected teams like Memphis and Dallas, but hello Toronto and Sacramento! The Kings, partly from being without DeMarcus Cousins, now have an SRS of just 1.96. Toronto, meanwhile, currently has the second-best mark in the league at 8.15. Unsurprisingly, a lot of teams from the West are listed here.

Tonight’s matchup between Houston and Golden State would place eighth with an SRS total of 13.01. None of the games would place among the 10 worst:

worst 10

So much tire fire, or dumpster fire? Any game featuring the 76ers rounds out the top five, but New York and Minnesota are also included in a decent amount. There is also Oklahoma City in one game. This may be #BOLD, but with Kevin Durant and Russell Westbrook back that team will likely never add to the 10 worst matchups.

Looking ahead, it’ll be “interesting” to see if a game with two teams’ SRS’ summing to a total of -20.00 or worse happens again. Only the 76ers and Timberwolves have an SRS of -10.00 or worse while third most-embarrassing Detroit sits at -7.63. The next 76ers-Timberwolves matchup takes place on January 30. Mark that down, figure out what kind of unsatisfying dinner to have, choose your least-favorite Gatorade flavor, and we can all be miserable together.

Lastly, the 10 most-even and, well, least-even matchups:

20 diff

Tonight’s Portland-Minnesota game barely misses out on the 10 largest differentials. Surprisingly, some of those games in the screenshot have been pretty fun, or at least close. The team with the worse SRS in those matchups is, to no surprise, 0-10.

The home team in the 10 most-even matchups, at least by SRS, is 8-2. Most look decently contested, but we’re not taking into account rest advantages, injuries, players returning from injuries, etc. Again, Oklahoma City is likely to see a rise in their SRS, the Kings may continue to dip, Detroit’s should be twice as bad for being as disappointing as they are, and Golden State should get a boost just because. Maybe I’ll make a new metric called SoupRS. If a team was a soup and I had a spoonful, my reaction would either hurt or help their original SRS. Basketball stats: Tasty, edible, digestible?

Looking back on 2015 over-under bets

We are now just over 1/4th of the way through the NBA season, so in celebration I decided to repost my thoughts on over-under lines from a couple months ago. Golden State makes me feel like a genius when I was really making a desperate attempt to be funny. The Bucks? Not so much. They’re almost halfway to their over-under line of 24.5. (These lines were taken from the Westgate SuperBook, by the way.)

Anyway, take a look. There’s blood from a few bad predictions, for sure.