
One of several screenshots Matt Femrite takes of his own stats and captions in third-person and hangs on his fridge.
Over the years, I’ve published a collection of NBA stats to fiddle with in Tableau, but updating during the season is a hassle over several months. Free throw splits were an exception, sometimes. A few days ago, I made a few changes worth writing about here rather than tweet about it only to lose its relevance after 15 seconds.
1997 to 1999
The first change was adding data from 1997 to 1999. Typically, I never include 1997 in what I research because I don’t trust the shot data on NBA.com, and the three-point line was shortened that season anyway. It was a different era I’d have to address each time when writing, though getting one extra season from players like Michael Jordan and Shaquille O’Neal is still appealing. Of course the era doesn’t really matter for free throw splits (and jump balls). There was no shortened free throw line, though now I want to devote 5,000 words to what would happen if that was a rule change.
Flagrant and Clear Path Free Throws
The bigger obstacle not just in 1997, but up to 1999 was how flagrant and clear free throws were recorded. I don’t even remember clear path fouls being a thing, but the sequence below frequently showed up and threw off how I separated free throws. On the far left is game number along with event number, type of event which labels shots, rebounds and stuff like that, and another column to specify what kind of event it was, though the clear path free throw was initially 17 instead of 11. That column is why it’s so easy to get free throw splits in R.

Below was another snag from NBA.com’s play-by-play feed where flagrant 2 of 2’s are actually just 1 of 1, though flagrant free throw 1 of 1’s are rare:
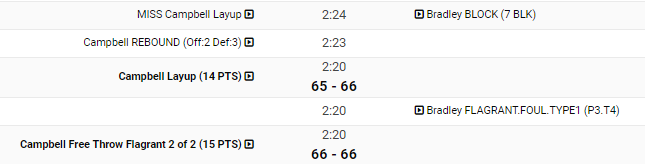
For these reasons, I excluded those years when publishing results last year, but now I grouped the clear path free throw with free throws 1 of 2, flagrant free throw 1 of 2 into free throws 2 of 2, and flagrant 2 of 2’s with free throws 1 of 1.
The flagrant free throws were eventually fixed and ordered properly on flagrant fouls, though clear path free throws were still a thing until 2006. This is something I don’t remember watching during my childhood and I don’t remember how I ordered these free throws last year, but my guess is they weren’t included.
After running everything in R and publishing results from back then, the total free throws were typically, slightly off. That’s not just because of clear path fouls, but because of a handful of missing games each season in data I was working with. Now, clear path free throws were grouped with free throws 1 of 1, and I must’ve received full play-by-play feeds a while back since the total free throws match those from NBA.com or Basketball-Reference. Darryl Blackport for MVP, as always.
And One
The last tweak I made was differentiating and ones from all free throws 1 of 1. There are several ways a player can attempt just one free throw outside of making a basket after being fouled, though they’re all rare. There’s the away from play foul, the inbound foul, the clear path foul explained above, and the loose ball foul on a made basket. 2014 Tyler Hansbrough drew the most of these fouls with seven. There are only 28 instances with more than three. Here’s a look at the most and-ones in a single season:

Screenshotting my own stats because of my massive ego.
One thing important to note about and-one totals, though. I doubt many totals pre-2006 will match Basketball-Reference’s that can be found in the Play-by-Play section of player pages. Basketball-Reference has an Event Finder tool that helps find a ton of stuff down to the exact time in a game when it happened, but for and-ones it’s hopeless. Before 2006, fouls in play-by-play data did not include who drew the foul.
As for post-2005, let’s compare my results with Basketball-Reference’s and have the player example be the and-one king, Shaquille O’Neal.
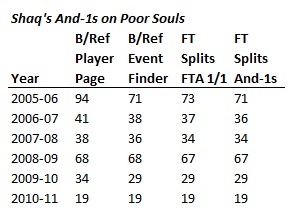
The Event Finder’s and-one opportunities differ from what’s on the Play-by-Play section, and the Event Finder differs from my findings because of these type of sequences in play-by-play data:


Hard to explain or adjust for it. Merging lane violations with the time of made baskets is possible, but I’d guess that it’ll attract more than and-one situations and be too time consuming. Play-by-play data and R make most research quick and easy, like these free throw splits, but the more I look at the more bizarre situations I find, also like these free throw splits. Eventually, problems are solved and so should this one, but it’s just not an immediate to-do. Obviously, I’d rather screenshot my own stats.
Again, you can find free throw splits here. Enjoy somewhat useful but mostly goofy stats.
