Tag Archives: NBA

Tables with shot location splits (from the Knicks post)

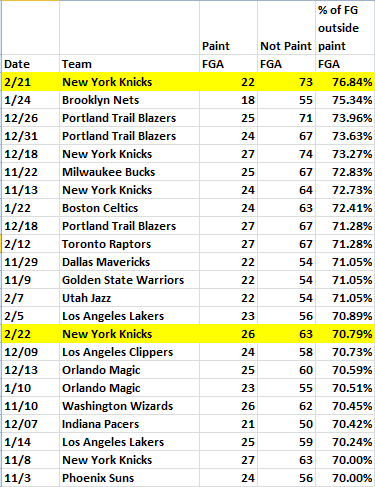
Below are some shot location splits I made to compare New York’s recent, excessive jump shooting with the rest of the league.

The first table looks at how many shots a team takes outside of the paint, according to NBA.com’s shooting stats. Here’s a link to it for maybe an easier view. This one should make it downloadable on Excel, where sorting columns are hopefully a possibility.

Anyway, here’s the posted table(s) from Google Sheets:

There isn’t anything too telling with how shots in the paint or out of it impacts offensive rating. The top 10 most efficient teams are scattered across the board. It’s worth noting, though, that only seven teams have taken more than half their shots in the paint.

Splits in wins and losses, found in the second sheet, also vary. In wins, the Nets, Pistons, Clippers, and Lakers all take a few less shots in the paint. The Bobcats, Cavaliers, Heat, and Magic have the opposite result. For Charlotte and Miami, maybe that’s from the impact of Al Jefferson and LeBron James, respectively.

Overall, though, I’m not sure it’s worth looking too into the stats because of, well, the difference in points from a mid-range jumper and a three-point shot not being specified (but will be in the second batch of tables). That doesn’t mean it’s not cool to post the splits, though, well hopefully.

But the next table’s a little more specific with where a team distributes their shots, sorting ones that often generate the most points (around the rim and from the arc) from the lowest (in the paint but not in the restricted area, and from mid-range). Here’s a link to the table for possibly easier viewing. This link should hopefully load in Excel.

This table has a more clear relation to both offensive rating and effective field goal percentage, though outliers like Philadelphia (poor Thaddeus Young, by the way) still remain. Detroit’s also one of the top teams to shoot around the rim or from three, though their efficiency takes a hit from Brandon Jennings and Josh Smith, among other players.

On the other side of the outliers is Oklahoma City, who’s in the middle of the pack with how many attempts they take around the rim and from three, though they’re sixth in offensive rating and EFG%. It helps to have nice mid-range shooters in Kevin Durant and Serge Ibaka. Same goes for Dallas with Dirk Nowitzki and Portland with LaMarcus Aldridge.

No team takes less than half of their shots from the high-efficiency areas of the floor, though Memphis is tip-toeing that ground with a near 50-50 split. Related: they’re 20th in offensive rating and 21st in EFG%.

Win-loss splits still vary. Golden State, for example, attempts two to three more shots from either mid-range or the non-restricted area part of the paint (that part of the floor seriously needs a better, shorter name) in wins. Swinging the other way are the Mavericks, Clippers, Pelicans, and Jazz all taking a few less shots from those low-efficiency spots on the floor with the Clippers having the biggest decrease, taking over five less shots in wins. Unsurprisingly, their EFG% improves by 9.1 percent though every team’s percentage has increased in wins. There’s hardly a difference in shot distribution for some teams like the Lakers, Magic, and Blazers, all changing by less than a quarter of a percent.

Just for fun, I included an extra table featuring which teams take more mid-range shots than ones around the rim, something I included in the Knicks-related post this morning. Unsurprisingly, Portland’s both at the top of that table and the only team to be in the top 10 in scoring efficiency. The rest of the teams, save for the Knicks, are either at the bottom 10 or flirting with it.

I also wanted to include game-by-game logs but they’re so big that I didn’t want to make this post extremely slow to load. They can be found here on Google Sheets or a link to Excel.

Any other thoughts are certainly welcome, and as a reminder this was related to the Knicks column I posted earlier today about their overreliance on the jump shot, even by their standards.

The Knicks’ recent overreliance on the jump shot

The last couple of Knicks games have been, well, rather Knicksy. Their defense has been lacking and badly, allowing 114.6 per 100 possessions according to NBA.com. Recently, though, New York’s scoring efficiency (104.7 points/100 possessions) has actually been higher than their average rate of 103.9 in their other 54 games, and how they distributed their shots across the floor is more than worth discussing by itself.

By design, New York takes a lot of shots from the perimeter, most notably when Carmelo Anthony is playing power forward. That’s usually fine since that happened for most of 2013 and their offense finished third in scoring efficiency. This season’s starting lineups have been different for a lot of reasons, but during the last two games their lineup had a makeup similar to 2013: Anthony at power forward with Tyson Chandler, two point guards, and a small forward to space the floor that’s currently J.R. Smith, though Iman Shumpert would likely start in his place if he were healthy.

The result has been A LOT of shots outside the paint, for better or worse. Below are their shot charts against Orlando and Atlanta with the former on the left and the latter on the right, via ESPN.com:

NY-ORL 2-21

The love for the jump shot is probably more noticeable against Orlando when the Knicks attempted 73 field goals outside the paint, according to NBA.com, which is the second-highest total by any team this season and surpassed only by their incredibly Knicksy game at Milwaukee on December 18. The percentage of shots they took outside the paint against Orlando, however, was the highest by any team at 76.84 percent, well above their league-leading average of 61. As for their outing against Atlanta, it was the 15th-highest percentage by any team at 70.79.

Teams on average take 52.7 percent of their shots outside the paint. I’ll have another blog post sharing a table of that, among other things. For now, here’s where the Knicks’ last two games fit in with the 21 other instances of excessive perimeter shooting:

New York

The Knicks are responsible for five of those 23 games and are the only team to pull them off in consecutive ones.

Anthony, Smith, Tim Hardaway Jr., and Raymond Felton combined for 109 of those 136 shots outside the paint, though they’re not totally bad attempts. Obviously, three-pointers are worth more than 20-foot twos and the Knicks took seven more threes on average than they normally would, but they also took 11 more mid-range shots per game. The shots that vanished were from around the rim, taking eight less attempts per game against Atlanta and Orlando. Even Chandler, who supplied a good chunk of the attempts around the rim thanks to alley-oops, got in on the fun from the dead zone of the floor but had little success.

Below is a simple breakdown of New York’s shot locations with the last two games bolded. The other 54 games are in regular font:

The same accuracy from the arc is nice to see, though Anthony hit some insane, heavily contested attempts during that stretch which helps explain the lower assist percentage. The mid-range accuracy is also steady but Amar’e Stoudemire and Anthony, for example, had upticks from there while combining for six less shots around the rim per game. For Anthony, some of that’s obvious when looking at his scoring outbursts from those games. He’d have isolations against a defender like Tobias Harris, someone he could probably take off the dribble whenever he wanted, but pulled up from either the arc or mid-range with (to his credit) decent success.

Overall, the Knicks’ shot distribution was out of whack when factoring in how many shots were taken in high-efficiency spots (around the rim and the arc) versus low-efficiency ones (non-restricted area spots in the paint and mid-range). New York took about the same number of shots from each with a 49-46 high-low efficiency distribution versus Orlando and 45-44 against Atlanta. That’s not exactly great when teams on average take about 57.5 percent of their shots either around the rim or from the three-point line, and each of those games placed among the bottom 25 percent of all outings this season in terms of what percentage of a team’s shots were taken from high-efficiency spots of the floor.

For the season, New York has been slightly above average with their distribution between high-efficiency shots and low ones, currently at 58.1 percent. Part of that isn’t surprising when they take the sixth-most threes per game, but they also take more shots from mid-range than they do at the rim, something the Blazers, Pacers, Wizards, Cavaliers, Magic, and Celtics do. Last year, 66.1 percent of their shots were from around the rim or three. That would’ve ranked 2nd this year.

Is this all something to panic over? The Knicks are in a state of panic as is. As constructed, though, they’re a team that relies on scoring with range with or without some their players currently injured. Once in a while there will be nights like the last two where they’ll fall head over heels in love with the jump shot, and along with their inconsistent defense it will cost them games. To be an optimist, though, there’s also the potential for their shooting to catch fire and get them back in the playoff hunt. Heck, it might open up more looks at the rim.

Whether New York lives or dies by the jump shot, it’s been remarkable watching just how much they can attach to it. They’ll host Dallas tonight, a team in the middle of the pack in allowing both shots around the rim and threes, according to NBA.com. Whether the Knicks continue to look allergic to the paint is something to look for along with the chance Vince Carter scores a season-high at the Garden.

Revisiting if Roy Hibbert could block more shots than an entire team

SONY DSC

Zach Primozic | Flickr

Once in a while I’ll revisit weird accomplishments I thought might happen, like a team winning more games than the Celtics and Lakers combined, or impressions left on me in the beginning of the season, like Josh Smith’s once-promising shot selection. Today I’ll revisit the possibility I brought up over two months ago of Roy Hibbert blocking more shots than an entire team.

If that sounds like a lofty accomplishment for the Pacers center, that’s because it is, but it’s not impossible. The last time a player recorded more blocks than another team was in 2009 when Dwight Howard had 231 blocks to the New York Knicks’ 204. New York, coached by Mike D’Antoni with a starting frontcourt of David Lee and Al Harrington, set the record for the least blocks during an 82-game season, though it wasn’t much better the season before when they were coached by Isiah Thomas. The Knicks of 2008, with a frontcourt of Zach Randolph and Eddy Curry, blocked just 213 shots. Josh Smith (227 blocks) and Marcus Camby (285) outswatted that squad and then some.

At the time of the first post, two squads this season were in danger of becoming like the Knicks of the late-2000s: the Kings and Timberwolves. Hibbert had 62 blocks to Sacramento’s 48, though Minnesota was within distance without Ronny Turiaf and their starting frontcourt of Kevin Love and Nikola Pekovic not posing much of a threat above the rim. As for the Kings, they had frontcourt depth consisting of DeMarcus Cousins, Chuck Hayes, Derrick Williams, Patrick Patterson and Jason Thompson. They come in all shapes and sizes, but none are elite shot blockers. Hayes and Patterson would eventually be traded for Rudy Gay.

Meanwhile, Hibbert was also just coming down to earth after recording 4.3 blocks per game over 30 minutes in his first 13 games. His block percentage while on the court, 10.2, had only been done over a full season six times with five coming from Manute Bol, and the most minutes played during any of those seasons was 26.1 during Bol’s 1986 campaign. Naturally, Hibbert’s block totals started to average out. He only had seven over his next six games and just two combined against the block-prone Bobcats and Timberwolves (Hibbert was also blockless Wednesday night in his second matchup against Minnesota). His block percentage during that six-game span was 2.7, right around the same percentage Paul Millsap and Chris Bosh have recorded this season. That’s not bad, but it’s also not even half the frequency Hibbert logged last season.

Note: Now is probably a good time to mention I’m not saying Hibbert or anyone else is a bad defender if/when they don’t block shots. They obviously don’t measure everything about inside defense and the same goes for looking at steals to evaluate perimeter defense. In fact, it’s pretty noticeable that Hibbert would rather be in position to use verticality to his advantage than go for a block and risk fouling. I’m also not exactly rooting for Hibbert or anyone else to block more shots if it comes at the expense of good, sound defense. It’s not the end of the world if someone does or doesn’t block more shots than an entire team, but it would be fun to talk about if it happened. Obviously, for me it’s been worth dedicating at least a couple posts just about the potential of accomplishment it.

So Hibbert went through a heater of some sort in the block department and then hit his version of a valley, averaging out to a block percentage of 8.1 through his first 18 games, according to Basketball-Reference. That rate, or one a sliver below it, would have to be sustained for a whole season to outblock a whole team. Howard, Camby, and Smith were 1-2 percentage points lower, but all played a handful more minutes per game and Camby’s Nuggets played at the league’s fastest pace in 2008. Indiana’s currently in the middle of the pack this year at 96.08, according to NBA.com, but no faster than the Kings or Timberwolves.

Hibbert’s block rates couldn’t hold up over his next 36 games, however, blocking only five percent of opposing shots in the same 30 minutes per game. For the season, his block percentage is 6.1. He’s been surpassed by a few other players in total blocks, and teams he once competed with such as the Kings and Timberwolves have since upped their blocks. Every team but Minnesota has totaled more than the 2009 Knicks did over 82 games.

Below is a table with Hibbert, a few other leading blockers, and four teams with the least blocks per game.

Player/Team Total Blocks BPG Games Block%* Minutes per
DeAndre Jordan 135 2.4 56 5.1 35.9
Roy Hibbert 133 2.5 54 6.1 30.4
Serge Ibaka 139 2.5 55 6.2 32.6
Anthony Davis 140 3.1 45 7.3 35.8
Minnesota Timberwolves 197 3.6 54 48.2
Cleveland Cavaliers 215 3.9 55 48.8
Sacramento Kings 214 4.0 54 48.5
Dallas Mavericks 228 4.1 55 48.1

* – according to Basketball-Reference.

Minnesota’s still far behind even the second-worst Cavaliers but they’ve blocked 5.4 shots per game in February, a top-10 mark in the league. They’re also in the top five in opponent field goal percentage around the rim at 57.4, though they allow the fourth most attempts so I’m not sure that’s worth the tradeoff (as well as playing without Pek). Indiana, meanwhile, has been suffocating as they’ve held opponents to just 49 percent. I’m pretty sure Hibbert and the rest of the Pacers will take that in exchange for less blocks.

Cleveland’s lacked in blocks lately, just 2.8 per game over their last 20. As nice of a player as Anderson Varejao has been, he’s never been much of a blocker yet he leads the team in that statistic. Spencer Hawes will be suiting up for them in the near future and he’s averaging 1.3 blocks per game, but the Sixers’ pace and defense have to be taken into account. Philadelphia’s the fastest team in the league by a wide margin and this month they’re flirting with last in both attempts at the rim and field goal percentage from there, all according to NBA.com. (Also, I doubt blocks are the main reason Cleveland traded for him, but this post is dedicated to those and not everything defense or the other side of the court.)

As for the players listed, it would’ve been fun if Anthony Davis were healthy the whole first half of the season. Add another 30 blocks to his total and it at least makes things interesting, especially if Cleveland continues their recent low tally in that statistic.

I guess the Brow made up for it though with this commercial:

Going forward, Davis and Jordan look like the best bets to block more shots than a team. As mentioned before, Hibbert has understandably looked to use verticality to his advantage rather than get a hand on the ball and risk foul trouble. Davis and Jordan are far more mobile and freakishly athletic to recover from situations where they’re either beat or hair late on a rotation to a driving guard. They also play in that 35-minute range that allows them more opportunities to tally blocks.

If I had to choose one or the other, though, it’d be Davis because of the likelihood his minutes not only stay the same next season but also increase. He’s also basically untradeable, something Jordan can’t say himself. Who knows if Jordan plays 36 minutes under most other coaches, which would keep him from flirting with 200 total blocks in one season.

Potential wildcards next year: JaVale McGee, Andre Drummond, and Larry Sanders. I like all of them when given the playing time and good health by the basketball gods. This season seems like a lost cause, though, which means the search for other weird stats continues.

The battle in the middle of the NBA lottery

By this point of the season, teams that started (and remain) with depleted rosters have come down to earth, making their way to the bottom of the league’s standings. Sometimes they become so bad they separate themselves from the rest of the pack, like the 2010 New Jersey Nets who were 4-48 at about this time four years ago, the 2012 and ’13 Charlotte Bobcats, and this season’s poor, poor Milwaukee Bucks.

A couple other teams are bound to be just as hopeless. Together they’ll combine for half, sometimes even two-thirds of the chances of lottery teams scoring a top-3 pick. Below is a slot-by-slot breakdown of the odds of reaching the final three:

  1. 64.3%
  2. 55.8%
  3. 46.9%
  4. 37.8%
  5. 29.2%
  6. 21.5%
  7. 15.0%
  8. 10.0%
  9. 6.1%
  10. 4.0%
  11. 2.9%
  12. 2.5%
  13. 2.2%
  14. 1.8%

The odds of landing a top-3 pick are still decent in places four through six, spots often up for grabs between several teams, some legitimate enough to be a force the following season with their current roster and a draft pick high enough to land a future star.

Take this season’s ongoing battle, for example. Six teams currently have between 18 and 20 wins, the difference between fourth and ninth place in the lottery and over a 30 percent chance of sitting in the top three on draft night. After those teams is a group of 22 and 23-win squads well within reach such as New Orleans, who already has a gem in Anthony Davis. Score a top-3 pick and the West has another team to worry about in 2015 and on.

Here’s a look at this season so far, not taking into account draft picks owed:

Tier 1 and 2 are pretty similar in terms of skill level and the stages of their franchises, though making up ground on Orlando and Philadelphia seem like quite a task. Each team can become that much worse with a trade before the deadline, but there’s still room for others to move up and grab anywhere from a fifth to a third of the lottery pie.

But is it really worth it for teams to tank for a serious chance at a high draft pick? It depends. Teams outside the top three or four in the lottery are vastly different from each other. Below are some examples of teams less likely to tank:

  • Teams that don’t own their own draft pick, like the current 20-32 Knicks. There’s no incentive for them to lose more games.
  • Others, like the 2010 Pacers and usually the Bucks don’t believe tanking helps as much as staying competitive while rebuilding.
  • Teams with rising stars such as the early days of LeBron James and currently the Brow, though I wish Cleveland hung on for one more top pick. Same with New Orleans with Nerlens Noel, or even a top-5 pick this summer.
  • Teams with good pieces looking to rise through a blockbuster trade, like the 2010-13 Rockets.
  • Teams that just acquired a star, like the 2005 Golden State Warriors with Baron Davis. I would include the 2013 Raptors or the current Kings except Rudy Gay has never even been an all-star. This can also apply to teams that splurged in the summer but struggled out of the gate, like this season’s Pistons after grabbing Josh Smith.
  • Teams stuck in no man’s land with established stars, like the 2006 and 2007 Timberwolves with Kevin Garnett and the 2013 Mavericks with Dirk Nowitzki. The 2009 Suns can also fall in here, but the standings at the end of the season showed a 17-game difference between ninth and 10th place in the West and 10 games between 13th and 14th in the lottery.
  • Playoff hopefuls going through injuries, like a ton of teams out East earlier this season, the 2013 Blazers, and the 2013 Timberwolves.
  • Talented pieces that don’t fit, like the 2013 Raptors and 2010 Grizzlies. Seriously, the 2010 Grizz featured Zach Randolph, Marc Gasol, Hasheem Thabeet, Rudy Gay, O.J. Mayo, Allen Iverson, Ronnie Brewer, Mike Conley, Jamaal Tinsley, and Marcus Williams. They might also fit under the teams that…
  • …want to see what they have versus resting them for a higher draft pick, but I honestly don’t remember a ton about that squad other than the names they had at one point or another. The 2013 Wizards and Timberwolves are probably better examples with them looking at the John WallBradley Beal combo and the Ricky RubioKevin LoveNikola Pekovic trio, respectively.

Basically, every situation is different.

Over the next two months, we’ll see which teams battle for a better slot in the lottery and which would rather chase for a playoff spot. At the moment, it seems like places eight to 14 will see a lot of action between East teams moving in and out of the playoff race. Places four to seven should also be active, and Sacramento is just too talented to be in fifth place.

Historically, teams have moved up and scored a top-3 pick (2005 Blazers), but others have lost major ground yet still hung on (2013 Wizards). Below is a history of lottery movement since 2003. Standings are as of February 11 of every season but 2012, which I moved up to March 11. That’s a week off compared to this year, sure, but standings are just about the same with teams already having played a similar percentage of games.

Anyway, take a look if you’d like (here’s a link too):

I didn’t adjust for playoff slots in the tables as of either February and March 11, as well as draft picks owed to other teams for any of the tables. Percentages were based off sites such as NBA.com, its team pages, and draft-based sites like DraftExpress. Percentages may still be off by a hundredth of a percentage point, but whatever.

Feel free to chime in with any other comments.

Looking at team-by-team conference splits

Over the last several weeks, I’ve started a series about non-conference matchups in a season where the West has had the upper hand by a historic margin. That margin, at least in terms of winning percentage against the East, is slowly shrinking but I thought it’d be fun to dive deeper into non-conference play anyway.

So after fooling around with the stats page at NBA.com, I made some conference splits. Just how well are teams performing against the East compared to the West?

Some net ratings per 100 possessions are pretty staggering. Only the Heat have a higher one against the West while the Jazz are even at zero. Below are the five worst differences against the West and the six best since there was a tie for fifth (you can also view it here):

It’s not all that surprising to see a team like the Kevin Love-led Timberwolves in the bottom five. Their offense is still somewhat there against the West, though their defense falls apart. At the same time, so does quite a few others and Minnesota’s net rating versus the West is slightly above the league average of -1.57. Positivity!

That’s only a small portion of the table I made, though, since I plucked basic, miscellaneous, and advanced stats from NBA.com. It actually killed an hour of boredom by making the massive table below. After posting that, I’ll include a few thoughts.

Scroll around to see the stats you’re curious about. Teams are sorted in alphabetical with net ratings, assist percentages, etc. first, miscellaneous stats like fast break points and points in the paint second, and basic stats third.

The table can also be viewed here, and I’d actually suggest that since the table is huge. It’s my first time using Google Docs links so any issues are encouraged to be brought up.

As a reminder, all stats are pace-adjusted and according to NBA.com.

Defensive efficiency

Defensive efficiency shows a pretty significant difference with teams on average allowing 4.49 points more per 100 possessions against West opponents. In particular, Detroit, Dallas, and Toronto all allow 10 or more. Only the Lakers (+1) and Spurs (+.01) have better defensive ratings against the West than the East, though the Lakers’ one is no accomplishment. More on that in the next paragraph.

The top five defensive ratings against the East are Indiana (91.1), Chicago (94.7), Toronto (96.5), Golden State (97.3), and Houston (97.6). The five worst are Los Angeles (106.3), Philadelphia (105.6), Milwaukee (105.6), Utah (104.7), and New York (104.5). Nothing too surprising, though New York’s defensive rating against the East WITH Tyson Chandler returning is 106.1, according to NBA.com.

The top five defenses against the West are Indiana (97.2), Oklahoma City (99.5), San Antonio (100.3), Golden State (100.6), and Charlotte (102.0). The five worst are Detroit (112.3), Dallas (109.4), Utah and Cleveland (108.6 each), and Sacramento (108.4). Indiana is a freak of nature. Detroit, meanwhile, is a punching bag.

Offensive Efficiency

Offensive efficiency doesn’t show anywhere as large of a difference as the defensive side. 14 teams score more points per 100 possessions against the West and only one team, San Antonio, has a difference larger than five points in either direction. They score 110.9 per 100 possessions against the East and 105 against West opponents.

The top five against the East are San Antonio (110.9), Oklahoma City (110.1), Portland (109.3), the Los Angeles Clippers (108.4), and Miami (108). The bottom five are Milwaukee (97.1), Utah (97.3), Cleveland (97.4), Philadelphia (97.6), and Memphis (98.9). Seems pretty standard as far as the top five go. On the other side, Cleveland is just embarrassing. For the Grizz, there’s plenty of time to improve on their number, though they need health to be on their side sooner or later.

The top five offenses against the West are Miami (112.1), Dallas (109.6), Los Angeles Clippers (109.2), Portland (108.4), and Houston (107.7) The bottom five are Philadelphia (94.4), Milwaukee (95.4), Chicago (95.6), Boston (97.6), and Orlando (97.8). No surprises all around except for maybe Dallas. Dirk Nowitzki needs more love. So much more love.

Pace

To go with the grind that is the East and the quick pace of the West, only five teams play faster against East opponents than West ones. Those five: Detroit, Golden State, Memphis, Orlando, and Sacramento.
Fast break points don’t show too much change, though. 17 teams score more fast break points against Western teams. The 30 teams on average score .38 more fast break points against them.

Threes

22 teams take less threes against the West. Those 22 teams take 1.72 less threes on average. 21 shoot a worse three point percentage, and those 21 average out at 2.97 percent worse. When factoring in every team, the average is 1.49 percent worse against the West compared to the East.

Paint

On average, teams average 2.54 more points in the paint against the West compared to the East, and only five teams average less. Those five: New Orleans, Boston, Houston, Philadelphia, and Orlando. The five highest increases: Dallas (+6.2), Indiana (+6.0), Miami (+5.5), Memphis (+5.4), and Detroit (+4.9).

Also, 21 teams foul less against the West while 18 average less blocked shots.

Free throws

19 teams take more free throws against the West, though overall teams take only .12 more attempts. Only nine teams foul more against West opponents.

Rebounding

21 teams rebound less per 100 possessions against the West and 22 rebound a lesser percentage. At the same time, 20 teams grab more offensive rebounds though 17 grab a higher percentage. 12 teams record more second chance points against the West opponents than East ones.

Passing

Six teams assist a higher percentage against the West: New York, Atlanta, Sacramento, Boston, Cleveland, and Utah. Overall, teams assist 2.28 percent less. Oklahoma City is in last place at a decrease of 8.3 percent.

14 teams have a lesser assist/turnover ratio, though, and only four teams turn it over more against the West: the Lakers, Minnesota, New York, and Chicago.

There’s a bunch of other stuff to look at. I just thought I’d share the table and some thoughts. Brighter people will draw better conclusions from it than I could. Basically, though, the West is obviously more strong, but also a different beast than the lesser conference. The difference in pace is what I find most surprising, at least so far.

Any other thoughts are welcome.

Though I made a formula to find the differences in stats between each conference, I’m not guaranteeing everything to be 100 percent correct, especially since opponent stats were confusing at first. There might be a team with, for example, an average of 1.2 rebounds less against the West instead of -1.2. Things like that.

Make with it whatever you’d like, though, and again any comments or corrections are welcome.