Tag Archives: Sacramento Kings

Chris Webber’s Hockey and Free Throw Assists (Updated)

34

Last summer I wrote a shooting profile of Chris Webber at Nylon Calculus and later posted some of his passing stats here. During all-star weekend, I added to the latter but never updated the post. With the Lowe Post podcasts featuring Howard Beck and Shane Battier mentioning Webber and those early-2000s Kings, now would be good to, like, post those updated numbers instead of letting them sit in a folder. I also spent some free time adding a few more games, random thoughts, and GIFs. Webber’s best years are very good GIF material.

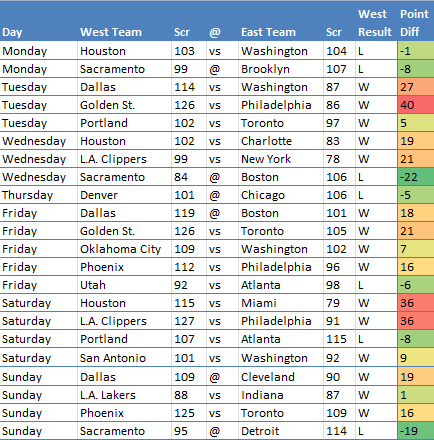
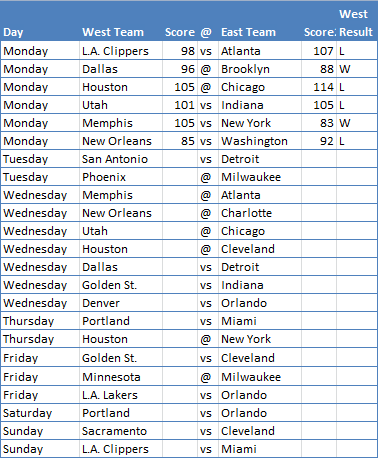
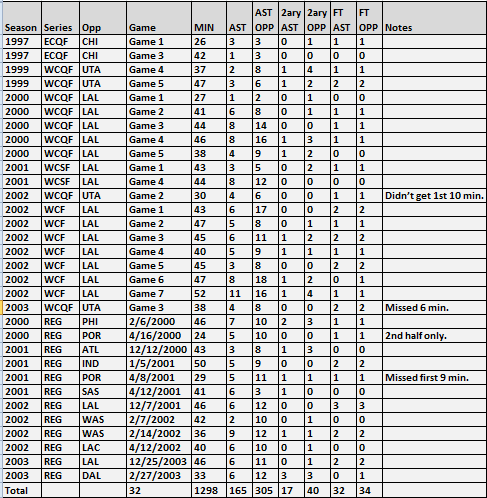
Below are the updated numbers. 2ary means secondary/hockey assists. It’s the same stuff found in player tracking statistics over the last two seasons:

web
Random Thoughts

  • Like 90 percent of the regular season games I watched weren’t in English, but that’s okay. There were a couple YouTube accounts with a TON of sports games from overseas and just so happened to have random Kings-Wizards, Kings-Clippers games. Maybe Sacramento really did have worldwide appeal?
  • This is still a small sample of games, less than 10 percent of Webber’s from 1999 to 2003 (added two 1997 games anyway). It would be nice to get more regular season totals, and maybe that’ll happen with how many random games pop up over each off-season.
  • The hockey assists are a little underwhelming, in my opinion, but as a team I feel like there’s no doubt the Kings would’ve crushed in this stat. Same with the late-90s Sonics teams, among others.
  • I may have been too picky on free throw assists, but I don’t remember if at first I gave them only to shooting fouls. If that’s what I was doing, Webber’s real free throw assist totals would get a nice boost considering how often he would use his behind-the-back pass to find a cutter near the rim.
    • Those passes definitely did not always work, by the way, but the payoff in the long run was greater than the occasional turnover. How exactly do you guard those, the normal passing angles and Webber’s scoring?
  • There were so many handoffs around the elbow to post-Magic Nick Anderson, one of a few players from 1999 to 2001 who I think are easy to forget. Maybe there wouldn’t be much of an assist difference since overall there isn’t much of one, but Anderson getting those handoffs around the arc instead of an older Peja Stojakovic, Hedo Turkoglu, or Mike Bibby…I don’t know. I should’ve tracked the assist opportunity field goal percentage on strickly jumpers.
  • Once Webber became a ~50 percent shooter from the elbows, those handoffs seemed like a low-key nightmare to guard. He was, um, clever enough to fake them for shots and attack cheating defenders off the dribble, but a reliable jumper was another effective option as a safety valve for whoever was running off him.
  • In terms of rivalries, from a distance it seems like the Kings’ were obviously the Lakers, but also the Jazz and Mavericks given the frequency of their playoff matchups. I remember from 2001 to 2004 they had some ridiculous games against the Timberwolves, too. 2004 was crazy. I got chills before Game 1 of the semifinals just from how much respect I had for the Kings. Not exactly the same feeling whenever the Timberwolves played the Lakers or Spurs…
    • For all the offense involved, the few Mavericks-Kings games I watched with or without Webber were a lot more physical and intense (Mavs fans and THEIR cowbells!) than I expected. Nothing like seeing these two play in the second round. The damn West.
  • For somebody of Webber’s value, he committed some really, really bad fouls. He also got away with some, such as a reach on Robert Horry in the final minutes of Game 6 in 2002. If that was called? Yikes. I love Webber’s offense and will defend his efficiency, but I also might be too harsh on his defense and rebounding.
  • It’s kind of jarring how different Webber was after his knee injury. Did this stage of his career really happen? His stint with Philadelphia in 2005, given his minutes per game, is probably one of 100 worst >500-minute stints/seasons in league history.
    • What other modern day guys would make the cut? 2004 Antoine Walker and 2013 Kevin Love? So much Sasha Pavlovic, too.
      • These random thoughts are getting really mean.
  • One of several fascinating statistics over Webber’s career: 2005-06 season, he was 32 years old and two years after knee surgery, but played 75 games and nearly 39 minutes per for his career high in season minutes.
  • Okay that’s it, enjoy some GIFs! Some may be potatoes, though.
    • Also, if you’re on a phone, beware: They’re on auto-play, and probably load slow at first because of that.

29

I thought that was a low-key amazing pass.

And then a few GIFs from the fourth quarter of Game 4 of the 2000 playoffs:

26

27

28

That was a really fantastic quarter.

Some other potatoes:

30

That might’ve been what made Webber unlikeable. 17-point lead with ~16 minutes to go and doing a little showboating, but these two teams played a pretty physical game a week prior and that was Webber’s former team. REVENGE OR SOMETHING.

33

That was literally the first possession of the game.

22

31

Fun times. Now, time to get all set for the 2015-16 season. Hope you all are, too.

Advertisement

East vs. West Week 10: Pythagorean madness

RIP Stuart Scott, who died Sunday at the age of 49.

A little late with the weekly roundup thanks to having the worst sleep schedule on planet earth.

Despite a legitimate Week 10 schedule for non-conference games, the West went 15-7 with a +10 point differential. That margin of victory made for a Pythagorean record of 17.6-4.4. Looking at the season so far, Week 10’s 2.6 win difference between the two win metrics is the largest we’ve seen this season. COOL. PYTHSANITY.

Below is the week-by-week summary below and actual scores from last week:

week10

So some large margins of victory came at the hands of East teams possibly running out of gas during their road trips out west. Philadelphia, Toronto, and Washington got, for the most part, roasted. In particular, this did not look fun for Washington:

Atlanta was/still is in good shape, though, having won at Utah and Portland on a back-to-back and the Clippers yesterday. WHOA. The top-5 or so out East gives the conference hope but it’s only January, for better or for worse.

Week 10 wasn’t pretty for all West teams anyway. The Sacramento Kings continued their downward spiral by going 0-3 on their road trip at Brooklyn, Boston, and the rising Detroit.

That’s about it for the bad times out West, though. A look into Week 11:

week11sched

The West enjoys another week of more home games, 14-9, though they already lost three of them. Cleveland, Detroit, Indiana, Miami, and Orlando will be traveling while Atlanta and Washington finished up their road trips last night.

Maybe this week will be different for the East. There are a lot of games featuring decent to pretty good teams from that conference and maybe they can squeak out an extra win or two compared to last week. But I’m not that picky. Losing by less than 20 points works, too. We need some more games that go down to the wire, specifically Cleveland @ Golden State on Friday.

Until next week.

The best, worst, most even, and most lopsided matchups by SRS

As noted in my previous post, we’re about 1/4th of the way through the NBA season. There’s very little time to reflect, however, as there are 10 games scheduled tonight. There are a couple nice matchups in Pelicans-Mavericks and Rockets-Warriors, some lopsided ones in Knicks-Spurs and Clippers-Pacers, and finally some in-between, perfectly mediocre games in Celtics-Hornets and Heat-Nuggets. WHAT A GREAT NIGHT.

I actually looked at which games applied to each of those categories over the first fourth of the season, measuring them by Basketball-Reference’s metric labeled SRS, or Simple Rating System. SRS takes into account a team’s point differential and strength of schedule. It is not a perfect metric, ignoring wins and losses as I’ve explained here, but to me it’s better than looking strictly at margin of victory, among other statistics. For reference, the Golden State Warriors currently have the best SRS at 9.54 while the 76ers have the league-worst at -11.89. Anything above, say, 5.00 is very good.

I like the metric, so I’ve kept track of every team’s SRS on game nights. The first couple weeks were cut out from this post, though, because SRS needs to even itself out over the first handful of games or so. We will always have the -22.20 from New York and +25.46 from Golden State on November 2.

Below have been the 10 best matchups so far, sorted by the sum of the SRS from both teams:

best 10

There are some expected teams like Memphis and Dallas, but hello Toronto and Sacramento! The Kings, partly from being without DeMarcus Cousins, now have an SRS of just 1.96. Toronto, meanwhile, currently has the second-best mark in the league at 8.15. Unsurprisingly, a lot of teams from the West are listed here.

Tonight’s matchup between Houston and Golden State would place eighth with an SRS total of 13.01. None of the games would place among the 10 worst:

worst 10

So much tire fire, or dumpster fire? Any game featuring the 76ers rounds out the top five, but New York and Minnesota are also included in a decent amount. There is also Oklahoma City in one game. This may be #BOLD, but with Kevin Durant and Russell Westbrook back that team will likely never add to the 10 worst matchups.

Looking ahead, it’ll be “interesting” to see if a game with two teams’ SRS’ summing to a total of -20.00 or worse happens again. Only the 76ers and Timberwolves have an SRS of -10.00 or worse while third most-embarrassing Detroit sits at -7.63. The next 76ers-Timberwolves matchup takes place on January 30. Mark that down, figure out what kind of unsatisfying dinner to have, choose your least-favorite Gatorade flavor, and we can all be miserable together.

Lastly, the 10 most-even and, well, least-even matchups:

20 diff

Tonight’s Portland-Minnesota game barely misses out on the 10 largest differentials. Surprisingly, some of those games in the screenshot have been pretty fun, or at least close. The team with the worse SRS in those matchups is, to no surprise, 0-10.

The home team in the 10 most-even matchups, at least by SRS, is 8-2. Most look decently contested, but we’re not taking into account rest advantages, injuries, players returning from injuries, etc. Again, Oklahoma City is likely to see a rise in their SRS, the Kings may continue to dip, Detroit’s should be twice as bad for being as disappointing as they are, and Golden State should get a boost just because. Maybe I’ll make a new metric called SoupRS. If a team was a soup and I had a spoonful, my reaction would either hurt or help their original SRS. Basketball stats: Tasty, edible, digestible?

East vs. West Week 5: Same result just re-defeated or something

(Not my best attempt to go off of the “same soup just re-heated” line.)

With the West going 18-7, Week 5’s end result was a bit like what we saw in Week 4 when they beat the East 18 out of 21 times. That means the West is 36-10 in their last two weeks despite 10 less home games. Fun times.

Week 5 actually looked interesting through Monday’s set of non-conference games. The East went 3-3, including Indiana beating Dallas on the road, but then the West took care of business. Golden State went 4-0 in non-conference games last week while Houston, the Clippers, Portland, and San Antonio each went 2-0. New Orleans lost both of their non-conference matchups. Meanwhile, Kobe Bryant and the Los Angeles Lakers are somehow 3-0 against the East after last night’s win against Toronto. (We will miss you, DeMar DeRozan.)

It also looks like the West also got a bit more brutal thanks to Oklahoma City getting back Crazy-High Usage Russell Westbrook. They’re something of a feature team in Week 6’s matchups as they play two non-conference games over next weekend:

week6

The home court advantage the East enjoyed the last two weeks is mostly gone. They play one more home game this week than the West, a mehhh 13-12 edge. They do have something of a rest advantage, though: 5-2 edge in games where one team has one or more days of rest compared to an opponent on the tail-end of a back-to-back.

But dang, this could be another bad week for the East in the wins and losses. Boston, Detroit, Indiana, New York, Orlando, and Philadelphia play a combined 14 games with Indiana and Orlando on road trips out west. Philadelphia’s arguably best chance to get their first win comes on the road against Minnesota. For someone about 45 minutes from Minneapolis, I really hope the Sixers get their first win in Oklahoma City instead.

For the most common teams in the West, they aren’t packing too much strength this week. Denver, the Lakers, Sacramento, and Utah play a combined 10 games. They’re no pushovers, but no Memphis Grizzly-type either. Dallas (three games), Golden State, the Clippers, Memphis, Portland, OKC, and San Antonio play combined 13 games.

Hopefully there are some upsets in the East’s favor. In the meantime, I’m really going to try and add some more posts this week. We’re just over a month into the season, so maybe time for a roundup relating to that.

Chris Webber’s assist distribution (and tracking data?)

Last season was the first with player tracking data logged for every team. While this continues to be nothing short of fantastic, the early-2000s feel like the Stone Age and the needy side of me wishes it was available for players of that era and earlier.

One example is Chris Webber and his passing. Among other dishes, watching him on the low post whip the ball behind his back to a cutter is a timeless joy. I could only watch so many of those highlights while attempting to write about his scoring before tallying up some passing stats, even some we’d see from the player tracking data today on NBA.com.

NBA.com has assist charts back to 1998 with shot locations from them, so I made distribution stats to sort through. One sheet has the basic shot zones and another uses NBA.com’s from their shot charts. (Names I gave each location can be found in a screenshot).

But hopefully just looking at the tables helps explain all of that:

Webber’s assist distribution (location assists/total assists)

What might be interesting are the swings in the threes, like nearly 1/4 of Webber’s assists coming from beyond the arc in Sacramento compared 15 to 20% everywhere else. That’s not too surprising given the differences in teammates, but I felt like going into a little detail:

Washington

  • The small percentage of threes make sense with Webber taking 2.9 per game himself and 33% of all attempts from there while on the floor, per NBA.com. No other starter averaged more than 0.6 attempts or cracked a 3P% of 30. Fun times.

Philadelphia

  • In 21 games in 2005 for the 76ers, there’s a spike in assists to the corner 3. That can be explained by Kyle Korver assisted eight times there and 21 overall. The decline from 3 with Philadelphia in 2007 could be explained by Allen Iverson‘s 3P% falling off a cliff before he was traded, Webber logging 264/544 minutes with Kevin Ollie who took 2 threes all season, no stretchy bigs, and the 2007 Sixers being super weird all season.

Sacramento (2001 to 2002)

  • There’s the trade of guards from Jason Williams to Mike Bibby. Webber logged 9.39% more of his minutes with the latter player who took nearly 1/3 more of his shots from mid-range. In 2002, Webber also played 17.47% more of his minutes with Hedo Turkoglu compared to 2001 and 10% less with Stojakovic. Between the two wings, their mid-range rate was about the same but Turkoglu had a slightly lesser three point rate. That was all from Basketball-Reference (table of % of MP w/ Webber here).

So the assist distribution looks fairly roster-dependent. The same can be said while comparing Webber’s %s with a few others: Kevin Garnett, Mike Bibby, and LeBron James.

It wasn’t just KG who loved mid-range shots in Minnesota. Ray Allen helped alter his and LeBron’s assist distribution when teaming up with each, but Shane Battier playing alongside James the last two years more than Udonis Haslem helped too. The differences with Bibby and Webber make sense with their pick and pop game (Christie + Webber too, and Bibby with other bigs). In 2002, 55% of Bibby-to-Webber assists were from mid-range, per NBA.com.

Looking at individuals assisted by Webber, here were some where he was their primary feeder: ’98 Rod Strickland, ’99&’00 Peja Stojakovic, ’01 Jason Williams, ’01-’05 Doug Christie (minus ’04), ’03&’05 Mike Bibby, and ’06 Allen Iverson, according to NBA.com. It’s vague as I just took total assists without weighing it with anything else like minutes with Webber versus other passers, but there’s no lineup data available pre-2001 to match NBA.com’s stats back to ’98. It does make me think, though, that in 2006 Webber would total more assists alongside a sharpshooter like Stojakovic, but with Iverson he’d collect more free throw assists.

Speaking of that, I’ll end this by sharing passing stats like those FT assists but also primary and secondary assist opportunities. These were from available playoff games on YouTube and I would’ve logged some regular season ones if not for my laptop dying during those:

webber assists

Those were some pretty decent defenses: The ’97 Bulls, ’99 Jazz (faded badly though), and the ’00-’02 Lakers. Dreadful defenses vs Sacramento probably paid a steeper price for being a half-step slower versus Webber, with him likely carving out more hockey and FT assists versus them.

Webber still stuffed the stat sheet even with teammates who didn’t take full advantage of primary and secondary assist chances. The 1999 and 2000 Kings were 5th and 3rd in 3PA rate, respectively, but 24th and 28th in 3P%. Stojakovic was still growing into the scoring shark he eventually became, Williams had a quick trigger, and Corliss Williamson was not a small forward who was going to stretch the floor. The 1999 Kings still had some flash, but they were kind of feisty.

As for 2000, Webber was a beast in Game 1 vs LAL, especially the first quarter, and his passing in the 4th quarter of Game 4 was sublime. In the dead part of the NBA off-season, I’d highly recommend watching those games and other full length ones of him on YouTube.

%d bloggers like this: