Category Archives: 2015 NBA Season

East vs. West Week 4: Here we go again

In Week 2’s non-conference roundup, I noted that last year’s Western Conference began their dominance in weeks 3 through 7. They went 69-23 during that stretch.

Well…

With an 18-3 record and a +10.9 point differential versus the East, last week was arguably the West’s third most impressive since starting these posts. In weeks 3 and 7 last season, the West went 13-1 with a +13.14 point differential and 16-2 with a +10.00 point differential, respectively.

There could a case for last week to be ranked higher. The West went 18-for-21 despite 19 of the games featuring their team going off zero or one day of rest compared to 13 occurrences for the East, plus nine games where an East team had a rest advantage of one day or more. The East also had five more home games with a 13-8 edge.

The issue came, as you might’ve guessed, with talent. Using SRS as one measure, at the time of 15 of the 21 games, the West team had a higher mark, per Basketball-Reference. The West won 14 of those games, their only loss when Chicago defeated the Clippers without Derrick Rose and Pau Gasol. It was a hell of a victory for the Bulls and ended what was a struggle of a Monday for the East. The Lakers won in Atlanta the next day, the West went 5-1 on Wednesday, Sacramento and the Clippers took advantage of some missing players on Chicago and Miami’s squads in their TNT games, and the weekend was quite ugly. The West went 6-1 from Friday to Sunday and outscored opponents by a total of 100 points. Ew.

I’m not sure it gets that much better for the East. Check out what matchups take place in Week 5:

week5

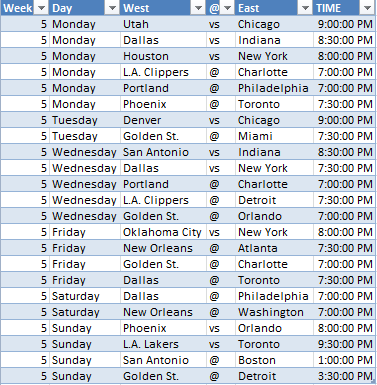
The East has another five-game advantage at home, but as usual the West has some heavy hitters. Golden State and Dallas each play four non-conference games while the Clippers, New Orleans, Phoenix, Portland, and San Antonio play two each. For the East, most frequently on the menu-I-MEAN-SCHEDULE is Charlotte, New York, and Toronto. Chicago, Detroit, Indiana, Orlando, and Philadelphia combine for eight other games. For the most part, that’s not great.

Some other bad news for the East might be that Houston, without Dwight Howard, does not play another non-conference game for another month after Monday’s matchup versus New York. Minnesota, not doing too hot without Ricky Rubio, among others, is also on a bit of a non-conference break. They play their next non-conference game on December 3 (Week 6) before playing a bunch of East foes in Week 8. The East will avoid Memphis for a while, though, so at least they won’t match up against one juggernaut.

But a few more are looking to feast. Last season, much of the West took advantage of road trips out East and against those traveling on west coast trips. Let’s see if it also continues to be the case this season.

East vs. West Week 3: Rough road trips for Brooklyn, Charlotte

Among other teams to take road trips out west, Brooklyn and Charlotte each had a rough go of it in Week 3 (and in Week 2). They went a combined 1-7, including 1-5 last week with the only win between the two coming from Charlotte over Phoenix on Friday night. The West’s struggles largely came from Utah and Oklahoma City, together going 1-5 including the latter team losing to Detroit on Friday.

Overall, the West went 12-7 in Week 3. That includes Thursday’s 53-point victory by Dallas over Philadelphia, who just had to go through the brutal Texas Triangle this season. You can see how that Mavs blowout screws with Pythagorean records:

Taking out Dallas’ victory, the West had a point differential of just 1.22 over the other 18 games and a Pythagorean record of 9.8-8.2. Kind of amazing what a difference one game can make. Over the course of an entire season, I’d like to believe enormous victories are balanced out with the occasional “upset”. Even if we’re taking into account point differentials of multiple teams versus just one.

Here’s how Week 4 looks:

week4

Week 4 brings 21 non-conference games with the West being repped in 10 of those by Phoenix, the Clippers, and San Antonio. Dallas, Portland, and Memphis take up six more games. Boston and Chicago have three games each for the East while Brooklyn, Cleveland and, um, Philadelphia play West foes twice. The East has a 13-8 edge in home/away games, so maybe that’s enough to prevent a solid week for the West.

Week 4 has a lot of fun matchups, though. In the meantime, I’m going to try and add some more posts this week. (Edit: Yeah that didn’t go well…)

East vs. West Week 2: The East rebounds after shaky start

Through one week, it looked like non-conference play would get out of hand in the West’s favor. It even looked brutal halfway through Week 2 with the West going 14-3 through Wednesday. Cleveland lost twice on their road trip with playoff hopefuls Miami and Charlotte suffering losses as well, but the East bounced back over the last few days by finishing 5-2. Charlotte losing last night to the Lakers really hurt, but the East finished Week 2 with a somewhat respectable record of 7-10.

Below is the week-by-week breakdown:

How does this season stack up to last year after two weeks? The 2014 West was 14-10 through November 10 but caught fire during weeks 3 through 7, going 69-23 through that stretch with an overall record of 83-33. That’s right about when these weirdo posts started.

Back to the present, 19 non-conference games are scheduled this week. For the West, Oklahoma City and Utah are among the teams with the most games while the East will feature a lot of Brooklyn and Charlotte:

nonconfsecheu

Week 3 might be a pivotal set of games for the West since Week 4 and 5 feature a combined 10 more home games for the East. Then again, maybe it’s all fine when a team as bad as the Lakers can blow out the Hornets. Seriously, how and why did that happen…

Anyway, enjoy this week of basketball!

East vs. West Week 1: Strong start to the 2014-15 season for the West

One week of non-conference play is in the books, and the West finished 6-1 against the East. The only loss came on Saturday night when Minnesota lost a close one against a Derrick Rose and Taj Gibson-less Bulls squad. The West did score some key wins, though, like Memphis over Charlotte in a game that felt like 2004 (the dead ball era) all over again.

Below is a breakdown of the first week. It’s much like the ones I did last year but with some new additions relating to Pythagorean record. Like last year, this table will also be updated weekly:

Though a large number through seven games, point differential says the West ran slightly better than expected. That’s probably thanks to Minnesota holding on against the Pistons Thursday night after blowing a 19-point lead in the 3rd quarter.

Week 1 is the last of light non-conference weeks until the all-star break. There will be 17 non-conference games in Week 2 and it will pick up even more after that. The teams most often in the Week 2 matchups are Minnesota, Cleveland, and Miami with three games each. Below are some of the most important games:

Monday:

Oklahoma City @ Brooklyn
Houston @ Miami

Tuesday:

Oklahoma City @ Toronto
Cleveland @ Portland

Sunday:

Miami @ Dallas

It looks like the East has one extra home game in Week 2 than the West, and the five key games listed above feature three of them on East courts. The East will have actually have a nice home-court stretch through Week 5, playing seven more home games than the West by then.

So starting with Cleveland playing three non-conference games this week, this could either be a stretch where the East gains some ground or the beginning of an onslaught by the West.

New Page: My Soup

nwI created some wonky stats over the off-season. Sometimes they were included in tweets with little success, but I dug myself a deeper hole by featuring some in blog posts and now a new page that lists those statistics. It starts with Shots Per 36 Compared to Average Player. You can find that with regular per-36 stats since 1998 here, via NBA.com.

This basically divides a player’s average field goal attempts per-36 from a certain zone by the average amount a player averaged that season. For example, a player who averaged 4.6 shots per 36 minutes in the restricted area in 2014 took 1.15x the average attempts per 36 for a player that season. The player in that example was Josh Smith:

josh smith

In the screenshot, you can see Josh Smith also had above-average accuracy around the rim last year. I also included that for every shot zone: Restricted area, in the paint (non-RA), mid-range, corner 3, above the break 3, and free throws.

I like to think this stat is helpful, but it has its limitations. With possession totals either estimated or newly released in their exact numbers, per-36 minutes stats are outdated but this is all I had to work with over the summer. Some players’ numbers will be a tenth of a point larger or smaller because of the pace of their team(s), but I feel fine in saying that these numbers are close enough to be taken seriously.

So how to best sort through tables? They are pretty huge since they list all players as far back as 1998 and Excel’s web app has its limitations. I’d suggest using filters to find what you’re looking for more efficiently.

Here are some examples.

You can narrow down each column by clicking the drop-downs and select either ‘Number Filters’ or ‘Filter…’:

filter1

For seasons, going with ‘Filter…’ is easier. Here’s what that looks like:

filter2

You can simply check and uncheck what seasons you want. ‘Number Filters’ is more useful for shot statistics:

filter top 10

If you want to find a specific, you can go to that drop-down and go to ‘Text Filters’. I’ll look for Rasheed Wallace:

name filter 2

namefilter 4 name filter 3

But if you want to group players together, go to ‘Filter…’, though it might help to narrow down the seasons too. There are also filters for total minutes and NBA.com’s usage rates.

namefilter

Again, you can find these stats and tables of Shots Per 36 Compared to Average Player here. Over the season, I might add on to this but there’s also a good chance more stats will be found at Nylon Calculus.