In between back-tapping missed shots and setting solid screens, Alex Len found a way to tally a career-high nine points last night while not committing a single foul. While that might only be baby steps for the Suns’ rookie center (he’s only played 12 games), the performance helped kick himself out of the as-many-fouls-as-points (AMFAP) club, at least for now. He has 25 points and 18 fouls for the season.
Good for Len, because the AMFAP club is one usually reserved for elite hackers and the offensively-challenged. There will be outliers since members often experience a majority of their minutes either during garbage time or very short, situational stints. Those with short-term contracts are also vulnerable to being cut from their respective teams before they can work their way out of a club only 12 players are a member of this season.
260 different players have been in the AMFAP club for at least one season. Five are VIP members, ones who finished their careers with over 1,000 minutes and more fouls than points. Charles Jones is the President after qualifying in 11 of his 15 seasons. He logged over 14,000 minutes with 2,076 fouls and 1,826 points.
Here are some other notable players who finished at least one season in the AMFAP club, sorted by their combined minutes in the seasons they qualified:
There are still 42 games left in the Suns’ season, which gives Len both plenty of time to distance himself from the not-so prestigious club and find himself back in it. Let’s hope it’s the former since the Suns could use extra contributions from everyone while competing without Eric Bledsoe. Heck, if he finishes the season with more points than fouls I’ll celebrate with a ham sandwich.
Last but not least, here are 15 players (not including Len) who are flirting with the AMFAP club:
Not listed is Jan Vesely, who’s resembled a professional basketball player this season. He had one of the more exciting AMFAP chases in league history last season. Or something like that.
Also, the AMFAP club could use a more clever name or abbreviation. Recommendations are welcome.
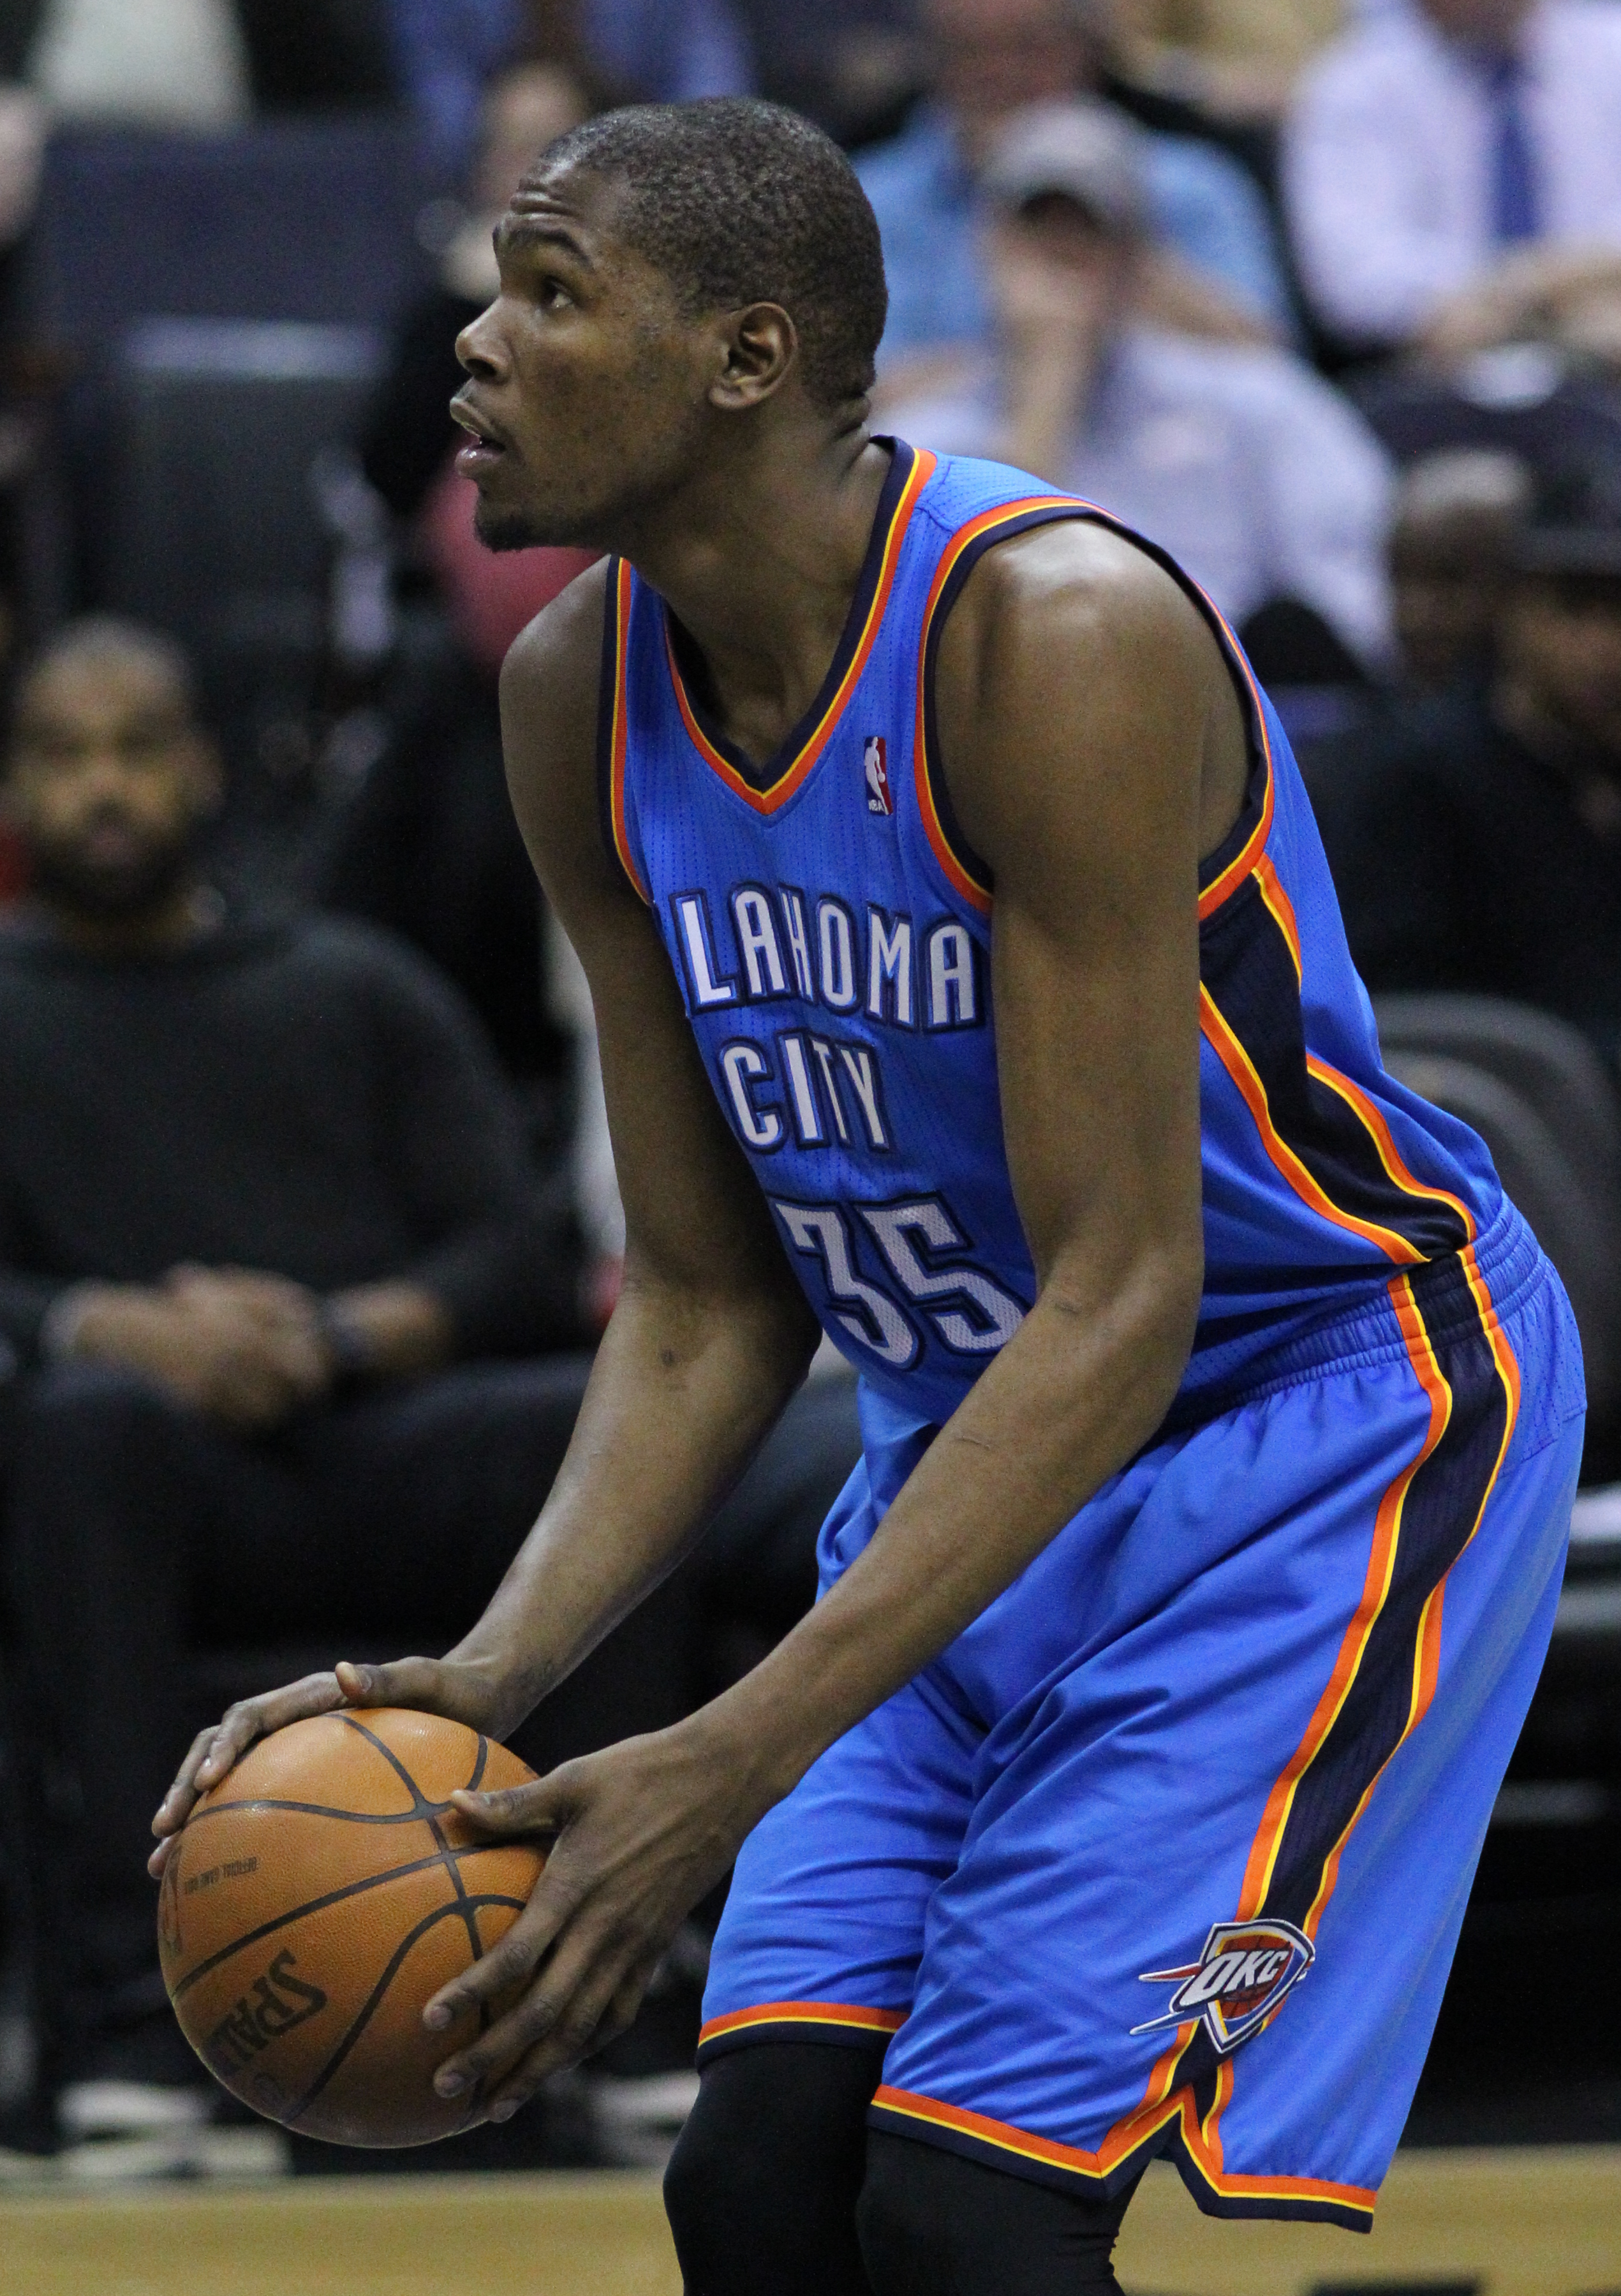
Last night’s matchup between Golden State and Oklahoma City became the 70th time an active NBA player scored 50 or more points. Cheers to Kevin Durant, who scored 54 points on just 28 shots. I’ll take a look at that night and the 68 others that featured 50-point scorers who have yet to hang it up, or so I think. Basketball-Reference lists players like Tracy McGrady, Jerry Stackhouse, and Richard Hamilton as active, but probably because it’s only a matter of time before they play for Brooklyn and round up an All-2000s squad. (For a simple table of the 50-point scorers, click here.)
Overall, 25 active players make up the list of 70 fifty-point outings across over 15 different seasons. 23 teams have been the victim of 50-point games while seven remain free of the embarrassment, though that could change while Kevin Durant continues his efficient explosion without Russell Westbrook. It only makes sense that teams with the 50-point scorer have won 50 of those 69 games.
Kobe Bryant has 24 of the 70 fifty-point occurrences with 16 coming post-Shaquille O’Neal and pre-Pau Gasol. The Lakers were 17-7 in those offensive explosions, including four consecutive wins in March 2007 (he averaged 40.4 points per game for the month). Bryant and Antawn Jamison are the only active players to score 50 points both against each other and on the same night, which is why there are 69 different games instead of 70. Jamison had back-to-back 50 point games in December of 2000.
Age
Brandon Jennings is the youngest player (20 years, 52 days) to ever score 50 points. I miss comparing him to Allen Iverson, which didn’t last long at all but nevertheless long live ‘Fear the Deer‘. As far as active players go, Andre Miller is the oldest (33 years, 317 days) to score 50. Both outings for the two players happened in the 2009-10 season, and theirshot chartsgreatly differentiate from one another.
Least and most attempts
The least amount of field goal attempts on a 50-point night belongs to Kevin Martin, who relied on 23 free throws and a good chunk of threes. Bryant’s 62-points-on-31-shots on December 20, 2005 could’ve given Martin a run, but he needed a few more shots to hit the 50-point mark. Instead, Bryant’s needed the most field goal attempts to get to 50 points (42 shots) when he finished with 53 points off 44 attempts in a loss to Houston. Surprisingly, Jerry Stackhouse’s 50-point night didn’t need 50 shots. He took 36, tied for 13th-most.
Other stats with 50 points
20 double-doubles (three from 10+ assists, 17 from 10+ rebounds) have been recorded from players scoring 50 points. Eight of those came from players logging over 48 minutes. As far as tons of minutes are concerned, sixteen 50-point games were recorded while playing over 48.
Kobe Bryant, Carmelo Anthony, and Kevin Love each had 50-point games without logging a single assist with Love’s coming while playing 49 minutes. As for Bryant and Anthony, they also had 50-point games where they didn’t record a single turnover. Surprisingly, that’s happened to Kobe not once but twice. Rashard Lewis is the only other player to accomplish such a feat.
Starting games versus coming off the bench
Every one of those seventy 50-point nights were from players who started, but a (currently active) player off the bench has scored 40+ points 14 times. That features nine different players who all needed starter-level minutes (30 or more). Each one of them also made at least one three-pointer.
A BOLD statement
The three-pointer brings me to my closing remarks regarding these high-octane outings. Only four times has a player who scored 50 points not made a three with those games belonging to Jermaine O’Neal, Amar’e Stoudemire, Tim Duncan, and Paul Pierce.
Going forward, I’ll go on a limb and say no 50-point game will happen again without a made three-point shot.
Going off my last post, I decided to list the other starting backcourts with usage ratings (possessions when a player takes a field goal, gets fouled or turns the ball over) of over 25 percent each. There were some guidelines, though:
They couldn’t be formed after a mid-season trade. (Allen Iverson played only three games for Denver before being traded to Detroit, so I included the ’09 Pistons.)
Both players had to start together, not just each starting whenever the other missed a few games.
I sorted through the Lottery Era up to last season.
There were quite a few cases where tandems interfered with the first two guidelines, but it made it easier to narrow down the list of qualified candidates and then calculate their effective field goal percentages, compare it to the team they played for, and then see how it matches up with the league average.
Free throw attempts per game will be missing from the table as well as some other notable stats. I had to narrow it down to a doable list otherwise it wouldn’t format correctly. Here’s what’s left of it, sorting each duo by the season. The stats are according to Basketball-Reference.
You can pick and choose what stands out here, if anything. Here are a few thoughts:
Backcourts who carry the load of an offense can be risky, but that’s not to say they often struggle. They can succeed when implemented with the right group of complimentary players and system. For example, I’m pretty comfortable letting Tony Parker and Manu Ginobili carry the offense, though I can’t say the same for two guys who couldn’t stretch the floor like Jerry Stackhouse and Michael Jordan.
I DON’T know how often some duo’s minutes were staggered because lineup data on NBA.com is only available from 2008 and on. Some backcourts, like Sixers of ’97, just look like they played a ton of time together. That couldn’t have been a good thing. Here are the minutes the previously-listed backcourt tandems logged together over the last six seasons, though:
Allen Iverson and Richard Hamilton: 23.2
Devin Harris and Vince Carter: 27.7
Richard Hamilton and Rodney Stuckey: 25.0
Tony Parker and Manu Ginobili: 19.6
Kyrie Irving and Dion Waiters: 21.4
The combo of Jordan and Stackhouse/Hamilton made the list when neither were point guards. Looking back, there wasn’t a whole ton of talent at that position for Washington. It speaks for itself when, in 2003, 70 percent of Larry Hughes’ minutes came at the point, according to Basketball-Reference. It’s kind of amazing that he, a 39-year-old Michael Jordan, and Jerry Stackhouse won even 37 games with their shooting, but that’s the power of MJ, I guess. It’s also impressive that Jordan used up 36 percent of the Wiz’s possessions in 2002. Overall, Washington had high-usage backcourt combos for four straight seasons until Cleveland splurged on Hughes.
Another oddity was Allan Houston and Latrell Sprewell making the list too. Basketball-Reference has them listed as a shooting guard during their careers at one point or another, though. I chose not to remove them from the list. Shooting guard and small forward tandems, or teams with three starting wings who used a ton of possessions (the early-2000s Bucks, for example) might be something I’ll look into in the near-future.
Again, this post isn’t meant to say high-usage backcourts often lead teams into mediocrity. Point guard-shooting guard duos (or in some cases, two shooting guards with one as a small forward) are just something I find interesting and worth looking at. It made me think, though, that if those backcourts used up a ton of possessions, then the team is more often than not sorely lacking talent in one other position.
It’s also pretty obvious that teams with two players taking a combined ~30 or more shots per game with inefficient stats (and one of them being the point guard) just won’t perform well. They might not frequently get to the line, take (and miss) several jumpshots, play lackluster defense in order to save energy on O, or some combination of the three. To repeat what I mentioned earlier, some (not all) of that can be helped by staggering minutes.
Going forward, I wonder how often we’ll see two guards with similar high usage rates, and how well their teams perform. Right now, Philadelphia and Washington have duos that would join the list but neither squad is doing all that well this season.
Anything else worth mentioning? Feel free to leave a comment.
Quite a few teams have jumped out to unexpectedly hot starts before the Christmas games, arguably the most surprising being the Portland Trail Blazers. They have tall tasks coming up against the Clippers, Heat and Thunder, but for now they’re 23-5 and first in the West, just barely ahead of Oklahoma City and San Antonio.
For Portland to get to 20 wins before Christmas is quite an accomplishment and a sign of success across the entire regular season. From 2000 to 2013, 30 teams out West have reached 20 wins before December 25, which averages out to about 2.3 teams per season. 2014 surpassed that mark with four total.
Below is a table showing each team in the West’s 20-win club over the last 14 years:
20 wins before Christmas
Season
Team
W-L by 12/25
82-game record
West rank
Finish
1999-00
Los Angeles Lakers
22-5
67-15
1
Won Finals
Portland Trail Blazers
20-7
59-23
3
Lost Conf. Finals
2000-01
Utah Jazz
20-8
53-29
4
Lost First Round
Los Angeles Lakers
20-10
56-26
2
Won Finals
2001-02
San Antonio Spurs
20-5
58-24
2
Lost Conf. Semifinals
Sacramento Kings
20-9
61-21
1
Lost Conf. Finals
2002-03
Dallas Mavericks
23-4
60-22
3
Lost Conf. Finals
Sacramento Kings
22-8
59-23
2
Lost Conf. Semifinals
2003-04
Los Angeles Lakers
20-6
56-26
2
Lost Finals
Sacramento Kings
20-6
55-27
4
Lost Conf. Semifinals
San Antonio Spurs
20-10
57-25
3
Lost Conf. Semifinals
2004-05
Phoenix Suns
23-3
62-20
1
Lost Conf. Finals
San Antonio Spurs
21-6
59-23
2
Won Finals
2005-06
San Antonio Spurs
21-6
63-19
1
Lost Conf. Semifinals
Dallas Mavericks
20-7
60-22
4
Lost Finals
2006-07
San Antonio Spurs
21-7
58-24
3
Won Finals
Dallas Mavericks
20-7
67-15
1
Lost First Round
Utah Jazz
20-8
51-31
4
Lost Conf. Semifinals
2007-08
2008-09
Los Angeles Lakers
23-5
65-17
1
Won Finals
2009-10
Los Angeles Lakers
23-4
57-25
1
Won Finals
Dallas Mavericks
20-9
55-27
2
Lost First Round
Denver Nuggets
20-9
53-29
4
Lost First Round
2010-11
San Antonio Spurs
25-4
61-21
1
Lost First Round
Dallas Mavericks
23-5
57-25
3
Won Finals
Utah Jazz
21-9
39-43
11
Missed Playoffs
Los Angeles Lakers
21-8
57-25
2
Lost Conf. Semifinals
Oklahoma City Thunder
20-10
55-27
4
Lost Conf. Finals
2011-12
2012-13
Oklahoma City Thunder
21-5
60-22
1
Lost Conf. Semifinals
Los Angeles Clippers
21-6
56-26
4
Lost First Round
San Antonio Spurs
21-8
58-24
2
Lost Finals
2013-14
Portland Trail Blazers
23-5
Oklahoma City Thunder
22-5
San Antonio Spurs
22-6
Los Angeles Clippers
20-9
34 teams
57.8-24.2
So average regular season records those teams finish with are often quite good. Only one team finished with less than 50 wins and the average 82-game record is just under 58-24. It wouldn’t be all that surprising to see all four teams this year finish with 58 wins before the playoffs, fattening up in non-conference matchups in the process. No team with over nine losses by Christmas, however, has won over 58 or more games since Chris Webber and the 2002 Kings. The Clippers are probably out of luck, at least until they get J.J. Redick back.
Only one team missed the playoffs on that list: The Utah Jazz of 2011 who had a mess of a season. They’d lost Carlos Boozer the summer prior and replaced him with Al Jefferson, who is now in Charlotte. Utah now has Richard Jefferson and his expiring contract. Will Utah replace him next summer by drafting another Jefferson? The Jazz also ended the season without Jerry Sloan and Deron Williams while prolonging a total rebuild. None of the four 20-win teams this year match what Utah went through. Portland did have an active off-season, but to match Utah’s they’d have to ship LaMarcus Aldridge for, say, David Lee, then have Damian Lillard request a trade down the road. Hmm…
Some other notables from the 20-wins-before-Christmas Club:
Of the 29 20-wins-before-Christmas teams that made the playoffs, six lost in the first round.
15 teams made at least the Conference Finals. It’s basically a lock that one of the four this year makes it unless we have a Houston-Golden State matchup. Not likely, but nonetheless possible.
10 of the 13 seasons have featured a 20-wins-before-Christmas team represent the West in the NBA Finals.
Portland, Oklahoma City, San Antonio, and the Los Angeles Clippers are in a club that often entails success down the road, but a few stumbled despite a hot start. Let’s see which starts were more on the fluky side and ones that were the real deal.
Until then, happy holidays. I need to wrap my presents. Where’s the duct tape?
Depending on what you characterize as “crunch time”, though, the sample sizes can be even smaller than the ones I included for this post. For example, if it means when there’s one minute left in a close game then some teams will have only totaled 10 to 15 minutes. There would also be a ton of free throws and last-second situations, which makes for inflated offensive ratings and pace.
FUN FACT: Only the Raptors have a pace below 100 with one minute left in crunch time, according to NBA.com, which makes sense when Dwane Casey has a knack for wasting 2-for-1 opportunities and/or not fouling when down with 25 seconds left:
Every other team has a pace ranging from 116 to 156. If we define crunch time as within five minutes left and either up or down by five points (like what I used to determine the go-to players), the pace goes down to anywhere between 90 and 105. We also get a larger sample size between 30 and 80 minutes, depending on the team.
Let’s see how this works out, beginning with the best and worst 10 teams according to net rating and then by shooting percentages.
Net Rating
The top 10
Team
MIN
W
L
OffRtg
DefRtg
NetRtg
+/-
PACE
Memphis Grizzlies
37
7
4
125.2
83.8
41.4
29
88.98
Portland Trail Blazers
51
12
2
133.9
95.5
38.4
49
101.28
Indiana Pacers
40
9
2
117.5
94.7
22.8
24
95.91
Philadelphia 76ers
64
6
7
115.1
94.2
20.9
10
105.18
Oklahoma City Thunder
48
10
3
115.9
98.8
17.1
18
104.18
Dallas Mavericks
47
9
7
105.7
90.9
14.8
26
92.86
Denver Nuggets
39
8
4
108.6
95
13.6
15
104.43
Phoenix Suns
49
10
6
112.5
99.2
13.3
15
95.24
Utah Jazz
46
5
6
123.4
112.3
11.1
15
94.64
New Orleans Pelicans
64
6
6
117
106
10.9
-4
95.89
It’s weird to see a positive net rating for the Pelicans when their plus-minus is negative four. I’m not exactly sure how that happened or how it happens in the first place.
The Marc Gasol-less Grizzlies are at the top, though. They’re the best defensive rebounding team in the league in crunch time, grabbing 85.3 percent of opponent’s misses and allowing only four second-chance points. Memphis also grinds the game to a halt, relinquishing only two fast break points and 22 points in the paint. The former stat ties with Miami for best in the league while the latter ties for second with Indiana and San Antonio. (Dallas is best at preventing points in the paint during crunch time by allowing only 20 over 46 minutes of play. Utah is near the top of that list, as well as in least fast break points allowed.)
Memphis seems misleading offensively, however. 35 of their 87 points come at the line, they’re horrible from the arc and they don’t get second chance or fast break points. Their offensive efficiency should drop in time and their defensive efficiency should take a hit without Gasol, though Tony Allen remains as a key defensive cog.
For the Blazers, they squeak into the top 10 in fast break and second chance points but blow teams away from the arc, shooting 18 for 39 on threes. It also helps when Damian Lillarddoes Damian Lillard things:
The Jazz are also up there in scoring efficiency, mostly thanks to shooting nine for 16 from three and a good dose of (gasp) Marvin Williams. Meanwhile, Oklahoma City has actually been terrible from the field, shooting just 15 for 60 on shots outside of the restricted area. It’s like them and the Jazz got their stats mixed up.
More on shooting percentages in a bit. Let’s look at the 10 worst teams in crunch time, according to their net rating:
The bottom 10
Team
MIN
W
L
OffRtg
DefRtg
NetRtg
+/-
PACE
Brooklyn Nets
41
4
8
80.1
106
-25.9
-32
102.7
Chicago Bulls
70
4
9
91
115.2
-24.3
-26
94.14
Golden State Warriors
59
5
7
88.4
112.4
-24
-24
95.38
Sacramento Kings
52
3
8
88.4
105.7
-17.3
-22
91
Orlando Magic
55
5
10
93.2
109.4
-16.1
-21
101.24
Atlanta Hawks
48
7
8
94.8
109.6
-14.9
-19
91.05
Milwaukee Bucks
62
4
9
96.9
109.8
-12.9
-19
101.23
New York Knicks
54
4
10
87.4
100.3
-12.9
-18
93.97
Charlotte Bobcats
41
6
8
91.5
104
-12.5
-15
100.9
Cleveland Cavaliers
54
7
7
92.7
103.3
-10.6
-9
92.51
It’s interesting that Toronto’s not up there until realizingRudy Gay was pretty good in late-game situations.
Quite a few of these teams are at or near the bottom 10 in allowing fast break and second chance points. They also give up a few more free throws. 22 of Golden State’s 54 free throws allowed, for example, have come within one minute left. The discrepancy of fouls drawn is huge within one minute as well, with Golden State only drawing two compared to being whistled for 14.
It’s odd that Golden State has one of the worst net ratings since Stephen Curry has been one of the best in crunch time, but the foul discrepancy over the final five minutes of close games is pretty consistent with the best and worst teams. Four of the top five with the largest foul differential not in their favor are also in the bottom 10 teams in regards to net efficiency. Meanwhile, four of the top five with fouling in their favor are in the top 10.
Large positive and negative net ratings are typical over the course of a season, but the small sample sizes allow for change over the next four months. Shooting percentages can also change. Let’s take a look at the 10 best and 10 worst shooting teams in the crunch, sorting them by effective field goal percentage.
Shooting Efficiency
The top 10
Team
MIN
eFG%
NetRtg
AST%
Field Goals
FG%
3FG
3FG%
FT
FT%
Portland Trail Blazers
51
0.581
38.4
0.512
41-86
47.7
18-39
46.2
48-58
82.8
Phoenix Suns
49
0.564
13.3
0.442
43-86
50.0
11-28
39.3
21-27
77.8
Philadelphia 76ers
64
0.562
20.9
0.560
50-97
51.5
9-22
40.9
42-55
76.4
Utah Jazz
46
0.549
11.1
0.514
35-72
48.6
9-16
56.3
35-44
79.5
Denver Nuggets
39
0.534
13.6
0.630
27-59
45.8
9-23
39.1
31-49
63.3
Miami Heat
35
0.519
8.6
0.696
23-52
44.2
8-20
40.0
24-32
75.0
San Antonio Spurs
30
0.508
-6.0
0.586
29-61
47.5
4-14
28.6
11-18
61.1
Dallas Mavericks
47
0.507
14.8
0.529
34-73
46.6
6-17
35.3
28-33
84.8
Memphis Grizzlies
37
0.500
41.4
0.542
24-52
46.2
4-14
28.6
35-42
83.3
Los Angeles Clippers
48
0.494
7.9
0.429
35-80
43.8
9-23
39.1
42-56
75.0
Weird note: Dallas and Phoenix already have 16 games that qualified for crunch time numbers, the most in the league. San Antonio has had the least games by far, with only 8.
I was expecting a lot of the Suns’ threes coming from drive-and-kick situations thanks to Eric Bledsoe and Goran Dragic, but most came from shots off the dribble. Gerald Green had one contested fast break three that displayed terrible judgment, but went in anyway. Whatever.
Not surprisingly, though, the best effective field goal percentages come from the teams draining threes. There are also teams you would expect to be at the top: Miami, San Antonio, Dallas, the Clippers, and probably Portland. “Star-less” teams like the Jazz and Nuggets are also shooting better than the Knicks, for example. More on New York in a bit.
There’s also a pretty big difference in assist percentage between the best and worst, among other stats. It’s no surprise that Toronto, Cleveland, Detroit, and Charlotte are at the bottom of that statistic when each often rely on their point guard or a wing to go one-on-five. And just like that, I spoiled nearly half of the bottom 10 teams:
The bottom 10
Team
MIN
eFG%
NetRtg
AST%
FGM
FG%
3FGM
3FG%
FT
FT%
Charlotte Bobcats
41
0.340
-24.3
0.348
23-72
31.9
3-18
16.7
27-33
81.8
New York Knicks
54
0.346
-10.6
0.607
28-91
30.8
7-36
19.4
31-35
88.6
Chicago Bulls
71
0.365
-17.3
0.579
38-115
33.0
8-30
26.7
33-44
75.0
Milwaukee Bucks
63
0.368
-12.9
0.516
31-95
32.6
8-23
34.8
36-46
78.3
Toronto Raptors
44
0.372
-2.5
0.346
26-78
33.3
6-20
30.0
22-35
62.9
Cleveland Cavaliers
54
0.390
-12.5
0.333
36-100
36.0
6-26
23.1
29-43
67.4
Detroit Pistons
51
0.392
-24.0
0.313
32-88
36.4
5-18
27.8
28-38
73.7
Brooklyn Nets
42
0.397
-25.9
0.440
25-68
36.8
4-19
21.1
14-27
51.9
Indiana Pacers
40
0.400
22.8
0.520
25-70
35.7
6-22
27.3
41-49
83.7
Golden State Warriors
60
0.410
-14.9
0.472
36-100
36.0
10-34
29.4
22-29
75.9
A few of these teams were expected to struggle. The Bulls and Nets have been depleted, Milwaukee’s a mess, and the Pacers – wait, what? Like last year, Indiana barely squeezes into the bottom 10 in shooting efficiency. Their free throws help put them in the middle of the league in true shooting, however. Overall, their offensive efficiency is about average.
At the bottom in effective field goal percentage are the Bobcats. Charlotte can’t seem to make anything outside the restricted area, but they have nothing on Carmelo Anthony, J.R. Smith and the rest of the Knicks. If we fiddle around with the minutes that represent crunch time, we get this out of New York:
More Knicks stats in crunch time
Time
MIN
OffRtg
DefRtg
NetRtg
FG
FG%
3FG
3FG%
FT
FT%
Last 2 minutes
21
83.6
83.3
0.40
8-42
19.0
0-18
0.0
22-26
84.6
Last 1 minute
11
71.3
90
-18.6
4-25
16.0
0-14
0.0
12 16
75.0
Those field goal percentages are dead last in the league. Only two of the made field goals within two minutes have come outside the paint (two-for-25). That should change for the better with Tyson Chandlerreturning as soon as tonight. It can’t get much worse, though I’ve come to expect the unexpected from New York.
Overall, the sample sizes are admittedly small but nonetheless worth looking at. There’s plenty of time for teams to turn things around but an awkward outlier or two will probably remain, like when the Charlotte Bobcats and the post-LeBron James pre-Kyrie Irving Cleveland Cavaliershad two of the best net ratings in crunch time in 2011. Miami will likely creep their way into the top 10 in terms of net rating as well. They’re just too suffocating to be left out.