Tag Archives: STATS

New Page: My Soup

nwI created some wonky stats over the off-season. Sometimes they were included in tweets with little success, but I dug myself a deeper hole by featuring some in blog posts and now a new page that lists those statistics. It starts with Shots Per 36 Compared to Average Player. You can find that with regular per-36 stats since 1998 here, via NBA.com.

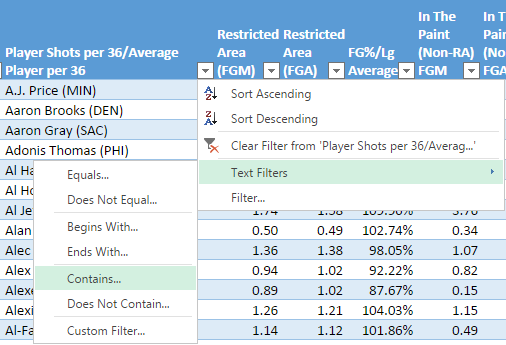
This basically divides a player’s average field goal attempts per-36 from a certain zone by the average amount a player averaged that season. For example, a player who averaged 4.6 shots per 36 minutes in the restricted area in 2014 took 1.15x the average attempts per 36 for a player that season. The player in that example was Josh Smith:

josh smith

In the screenshot, you can see Josh Smith also had above-average accuracy around the rim last year. I also included that for every shot zone: Restricted area, in the paint (non-RA), mid-range, corner 3, above the break 3, and free throws.

I like to think this stat is helpful, but it has its limitations. With possession totals either estimated or newly released in their exact numbers, per-36 minutes stats are outdated but this is all I had to work with over the summer. Some players’ numbers will be a tenth of a point larger or smaller because of the pace of their team(s), but I feel fine in saying that these numbers are close enough to be taken seriously.

So how to best sort through tables? They are pretty huge since they list all players as far back as 1998 and Excel’s web app has its limitations. I’d suggest using filters to find what you’re looking for more efficiently.

Here are some examples.

You can narrow down each column by clicking the drop-downs and select either ‘Number Filters’ or ‘Filter…’:

filter1

For seasons, going with ‘Filter…’ is easier. Here’s what that looks like:

filter2

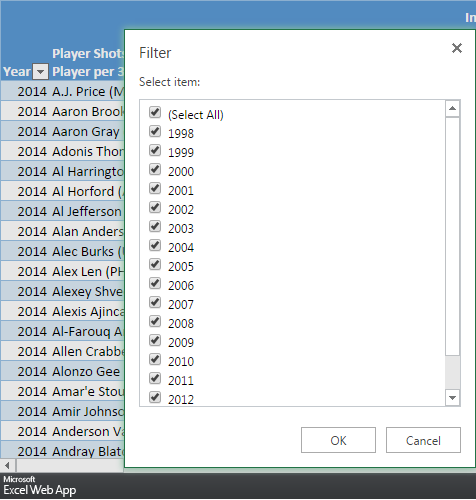
You can simply check and uncheck what seasons you want. ‘Number Filters’ is more useful for shot statistics:

filter top 10

If you want to find a specific, you can go to that drop-down and go to ‘Text Filters’. I’ll look for Rasheed Wallace:

name filter 2

namefilter 4 name filter 3

But if you want to group players together, go to ‘Filter…’, though it might help to narrow down the seasons too. There are also filters for total minutes and NBA.com’s usage rates.

namefilter

Again, you can find these stats and tables of Shots Per 36 Compared to Average Player here. Over the season, I might add on to this but there’s also a good chance more stats will be found at Nylon Calculus.

Advertisement

Tables with shot location splits (from the Knicks post)

Below are some shot location splits I made to compare New York’s recent, excessive jump shooting with the rest of the league.

The first table looks at how many shots a team takes outside of the paint, according to NBA.com’s shooting stats. Here’s a link to it for maybe an easier view. This one should make it downloadable on Excel, where sorting columns are hopefully a possibility.

Anyway, here’s the posted table(s) from Google Sheets:

There isn’t anything too telling with how shots in the paint or out of it impacts offensive rating. The top 10 most efficient teams are scattered across the board. It’s worth noting, though, that only seven teams have taken more than half their shots in the paint.

Splits in wins and losses, found in the second sheet, also vary. In wins, the Nets, Pistons, Clippers, and Lakers all take a few less shots in the paint. The Bobcats, Cavaliers, Heat, and Magic have the opposite result. For Charlotte and Miami, maybe that’s from the impact of Al Jefferson and LeBron James, respectively.

Overall, though, I’m not sure it’s worth looking too into the stats because of, well, the difference in points from a mid-range jumper and a three-point shot not being specified (but will be in the second batch of tables). That doesn’t mean it’s not cool to post the splits, though, well hopefully.

But the next table’s a little more specific with where a team distributes their shots, sorting ones that often generate the most points (around the rim and from the arc) from the lowest (in the paint but not in the restricted area, and from mid-range). Here’s a link to the table for possibly easier viewing. This link should hopefully load in Excel.

This table has a more clear relation to both offensive rating and effective field goal percentage, though outliers like Philadelphia (poor Thaddeus Young, by the way) still remain. Detroit’s also one of the top teams to shoot around the rim or from three, though their efficiency takes a hit from Brandon Jennings and Josh Smith, among other players.

On the other side of the outliers is Oklahoma City, who’s in the middle of the pack with how many attempts they take around the rim and from three, though they’re sixth in offensive rating and EFG%. It helps to have nice mid-range shooters in Kevin Durant and Serge Ibaka. Same goes for Dallas with Dirk Nowitzki and Portland with LaMarcus Aldridge.

No team takes less than half of their shots from the high-efficiency areas of the floor, though Memphis is tip-toeing that ground with a near 50-50 split. Related: they’re 20th in offensive rating and 21st in EFG%.

Win-loss splits still vary. Golden State, for example, attempts two to three more shots from either mid-range or the non-restricted area part of the paint (that part of the floor seriously needs a better, shorter name) in wins. Swinging the other way are the Mavericks, Clippers, Pelicans, and Jazz all taking a few less shots from those low-efficiency spots on the floor with the Clippers having the biggest decrease, taking over five less shots in wins. Unsurprisingly, their EFG% improves by 9.1 percent though every team’s percentage has increased in wins. There’s hardly a difference in shot distribution for some teams like the Lakers, Magic, and Blazers, all changing by less than a quarter of a percent.

Just for fun, I included an extra table featuring which teams take more mid-range shots than ones around the rim, something I included in the Knicks-related post this morning. Unsurprisingly, Portland’s both at the top of that table and the only team to be in the top 10 in scoring efficiency. The rest of the teams, save for the Knicks, are either at the bottom 10 or flirting with it.

I also wanted to include game-by-game logs but they’re so big that I didn’t want to make this post extremely slow to load. They can be found here on Google Sheets or a link to Excel.

Any other thoughts are certainly welcome, and as a reminder this was related to the Knicks column I posted earlier today about their overreliance on the jump shot, even by their standards.

The good, the bad, and the ugly shooting stats from SportVU

sportvu

We’re now one month into the NBA season, but also one month into sorting through STATS LLC’s SportVU Player Tracking system where stats from hockey assists to a player’s speed can be tracked, among other things. (Shameless promotion: I wrote about my first impressions of it here.)

And though it’s still too early to draw permanent impressions from information it’s spat out, some of it is still glaring like shooting percentages, for example. It’s easy to decipher between a pull-up jumper and a catch-and-shoot situation, making those two statistics a couple of the easiest to sort through the good, bad, and ugly that I handpicked and posted here.

For ‘the good’ and ‘the bad’, I took a handful of players from each category I thought qualified while one special player made ‘the ugly’.

I also included two other SportVU categories: Drives and Defensive Impact to go along with Pull-Up and Catch and Shoot.

Anyway, enjoy:

Pull-Up

The good:

FGM FGA FG% 3PTM 3PTA 3PT%
Patty Mills 21 37 56.8% 5 7 71.4%
Dirk Nowitzki 41 86 48.3% 2 4 50%
O.J. Mayo 40 84 47.6% 9 15 60%
Eric Bledsoe 36 77 46.8% 10 22 45.5%
Kevin Durant 52 115 45.2% 11 21 52.4%

This is all quite amazing. Bledsoe, a perceived brick thrower last year, has been hot this season. It’s one example of why I wrote some of the stats being glaring. These all may be small sample sizes right now, but they catch the eye nonetheless and make me curious if they hold up in the long run.

The bad:

  FGM FGA FG% 3PTM 3PTA 3PT%
Steve Nash 9 38 23.7% 2 6 33.3%
Luke Ridnour 9 46 19.6% 1 9 11.1%
Lance Stephenson 5 30 16.7% 0 4 0%
Tyreke Evans 7 43 16.3% 0 7 0%
J.R. Smith 10 62 16.1% 1 17 5.9%

Even with his improvements across the board, I still think Lance Stephenson shoots with his eyes closed.

The ugly:

  FGM FGA FG% 3PTM 3PTA 3PT%
Corey Brewer 0 30 0% 0 8 0%

Kevin Love‘s outlet passes make up for this.

Catch and Shoot

The good:

FGM FGA FG% 3PTM 3PTA 3PT%
Harrison Barnes 18 27 66.7% 12 20 60%
Andre Iguodala 24 39 61.5% 21 34 61.8%
LeBron James 21 36 58.3% 18 30 60%
Anderson Varejao 27 48 56.3% 0 4 0%
Ryan Anderson 28 52 53.8% 26 46 56.5%

Could someone make this a 5-man lineup and see if anyone dribbles?

The ugly:

FGM FGA FG% 3PTM 3PTA 3PT%
Jeff Teague 8 35 22.9% 8 31 23.3%
Trey Burke 4 20 20% 4 14 28.6%
Reggie Bullock 4 22 18.2% 4 21 19%
Eric Bledsoe 3 17 17.6% 2 15 13.3%
Alexey Shved 3 18 16.7% 3 15 20%

There’s Eric Bledsoe again. Another notable is Reggie Bullock, who has the potential to carve out a career as a three-and-D wing, one the Clippers could use right now but he hasn’t provided much so far.

The ugly:

FGM FGA FG% 3PTM 3PTA 3PT%
Jamaal Tinsley 0 13 0 0 13 0

Who knows if Tinsley can revive these numbers. He was waived three weeks ago by the Jazz.

Defensive Impact

The good:

OPP FGM at rim per game OPP FGA at rim per game OPP FG% at rim
Brook Lopez 3.0 8.8 34.1%
Roy Hibbert 3.6 9.9 36.9%
Chris Kaman 2.2 5.8 37.7%
John Henson 2.3 5.7 40.0%
Bismack Biyombo 2.1 5.3 40.5%

Chris Kaman making a list like this is so much better than one about centers who take wayyy too many jumpers. Also worth noting is John Henson, who in time can form a nice rim-protecting duo with Larry Sanders (whenever the latter plays again).

The bad:

OPP FGM at rim per game OPP FGA at rim per game OPP FG% at rim
DeAndre Jordan 5 8.4 59.2%
J.J. Hickson 3.3 5.4 59.8%
Gustavo Ayon 3.3 5.4 60.5%
Al Jefferson 3.8 6.1 61.8%
Anderson Varejao 4.1 6.4 63.3%

Before the season, it sounded like DeAndre Jordan was going to be Defensive Player of the Year, so this disappoints me intensely.

The ugly:

OPP FGM at rim per game OPP FGA at rim per game OPP FG% at rim
Udonis Haslem 1.8 2.4 72.7%

Who knows just how much of an impact Haslem will be going forward since Michael Beasley is logging consistent (AND PRODUCTIVE!!!) minutes off the bench.

Drives

The good:

FG% on drives Total Drives Player PTS on Drives Drives per game PPG on Drives Team PPG on drives
Manu Ginobili 75.0% 53 42 3.1 2.5 4.1
LeBron James 68.4% 92 72 5.4 4.2 6.6
Andre Iguodala 66.7% 32 15 2.5 1.2 3.3
Jeremy Lin  65.4% 137 96 8.6 6 10.6
Tony Parker 64.5% 154 111 9.6 6.9 11.3

You can pick and choose which player is more meaningful when driving to the rim, with LeBron likely being a favorite.

The bad:

FG% on drives Total Drives Player PTS on Drives Drives per game PPG on Drives Team PPG on drives
Vince Carter  33.3% 50 34 2.9 2 3.1
Deron Williams  33.3% 39 10 4.3 1.1 4.1
Corey Brewer 33.3% 37 20 1.9 1.1 2.3
O.J. Mayo 27.6% 47 22 3.1 1.5 2.9
Russell Westbrook  21.7% 90 35 7.5 2.9 7.1

Surely Russell Westbrook’s percentages will bounce back. I worry about Corey Brewer’s though. He’s like a paper airplane: once you let him fly, you have no idea where he’ll land. It’s made for several “noooo…yes!” moments and vice versa.

The ugly:

FG% on drives Total Drives Player PTS on Drives Drives per game PPG on Drives Team PPG on drives
Jose Calderon 0% 30 2 1.8 0.1 1.7

This isn’t really terrible since Jose Calderon is in the top 50 in hockey assists at least. He rarely gets into the paint anyway compared to the rest of the league’s guards, though the points he generates per drive is more similar to those in ‘the bad’ category than ‘the good’.

Through 17 games, Calderon’s stats when driving to the rim are more perplexing than ugly.

All statistics are from NBA.com

Since 2003, over 3/4 of teams under .500 on November 18 miss the playoffs

If your favorite team is off to a bad start, you can look that stat in the headline in two different ways:

  • Since 2003, 76.7 percent of teams that are under .500 coming into November 18 have missed the playoffs, failing to put the pieces together in another season of letdowns.
  • Since 2003, 23.3 percent have come back to make the playoffs and win their fans back with five months of great basketball. The first three weeks? Well, that was just a flesh wound.

A total of 30 teams out of 129 have come back to contend. You might think most of those came from the East since we’re in an era where the West has been loaded, but only 16 were from the inferior conference. And they’re not all teams who just barely make the postseason. Two defending champions, the Shaq-led ’03 Lakers and ’07 Heat, started out flat. Others like the ’07 Suns, ’07 Bulls, and ’11 Grizzlies were pesky outs.

Here’s the complete list. I left out the lockout-shortened 2012 season:

2003 (4 out of 13 teams): Los Angeles Lakers (3-7), Portland (4-6), Utah (4-7), Minnesota (5-6)

2004 (2/11): New Jersey (5-6), New York (3-7)

2005 (4/12): New Jersey (2-6), Chicago (0-6), Denver (3-5), Memphis (3-5)

2006 (3/14): Chicago (3-5), Los Angeles Lakers (4-5), Sacramento (4-5)

2007 (5/14): Toronto (2-7), Chicago (3-6), Miami (4-5), Washington (4-5), Phoenix (3-6)

2008 (2/14): New Jersey (3-6), Washington (4-5)

2009 (2/12): Chicago (5-6), Dallas (4-7)

2010 (2/14): Charlotte (3-8), San Antonio (4-5)

2011 (3/13): New York (4-8), Philadelphia (2-10), Memphis (4-8)

2013 (3/12): Indiana (4-7), Denver (4-6), Houston (4-6) 

2014 (???/15): 

Who will make the list this year?

So far, 15 teams are under .500: (deep breath) Philadelphia, Boston, Toronto, New York, Brooklyn, Cleveland, Detroit, Milwaukee, Orlando, Washington, New Orleans, Sacramento, Los Angeles Lakers, Utah, and Denver. No more than five and no less than two have made the playoffs. If we’re going straight by the math over the last decade, we can pick three or four.

I’ll pick four and they’re all coming from the East. Out in the West, the most likely under .500 candidates to surge back are the Lakers and Pelicans yet they’ll have to overtake Memphis, who sits in tenth place and in time will pass ninth-place Phoenix. Basically, nobody under .500 from the West will come back this year, though Kobe Bryant‘s return and Anthony Davis monster sophomore season at least made me think about it. Oh well. There are still nine teams from the East to choose from.

Every team in the Atlantic Division is under .500, which is embarrassing but one has to win and get the fourth seed by default. I’d expect New York and Brooklyn to limp into the finish line, maybe seeing them battle in the first round of the playoffs. At the very least, they both get in. The East is just too terrible for them not to.

From there I’ll go with Detroit, who didn’t sign Josh Smith just to tank the season away. I already wrote a little about their frontcourt woes while wondering why nobody is fouling Andre Drummond, but I expect the team to play better as the season goes on. I mean, they can’t be much worse defensively, right? If they somehow are, Greg Monroe can be moved for a piece that’s a better fit, one that’s good enough to put Detroit in the playoffs. I’d like to think of them being a pesky out for a title contender, at least pushing the series to five games.

That leaves one more team, and it gets painful to pick and choose who will get destroyed by Miami or Indiana, but I’ll go with Washington. They can make a move or two before the deadline with whatever Trevor Ariza will attract, but could (and probably will) also fire Randy Wittman and hopefully gain wins down the line with a coach that, you know, can get the job done with John Wall, Bradley Beal, and Marcin ‘Too Hot To’ Gortat.

Toronto can make moves too, especially with Rudy Gay and DeMar DeRozan, but a trade will more often than one to push themselves into the lottery. As for Cleveland, they seem to be a mess led by Kyrie Irving, Dion Waiters, and Anderson Varejao. Somehow, they can’t score with those three guys. Cleveland was a tough choice though since they too are primed for a trade down the road.

The East in general is a crap shoot, but it wasn’t expected to be this bad out of the gates. Right now if the conference were a Myspace account, Orlando, Philadelphia, Toronto, and Charlotte would be in the East’s top eight, along with Miami and the like. By the end of the season, they’ll all have grown sour and made room for New York, Brooklyn, Detroit, and Washington.

%d bloggers like this: