After experimenting with point distribution charts for teams and with J.R. Smith’s shooting explosion, I thought it’d be fun to apply the same ones for the top 10 players in points per game this season.
As usual, these graphs visualize points per game across six different locations on the floor: restricted area, in the paint (non-RA), mid-range, corner three, above the break three, and three throws. This time however, those graphs of the 10 players will also include the exact points per location below them and where that production ranks among the 480 players to log playing time this season. All of that is according to NBA.com.
Also, the axis for the 10 players will vary depending on the player, but at the very end of the post I’ll make a common one to show each of the 10 charts in a single GIF, sorted from the highest scorer to the lowest.
With all that said, here are the point distribution charts of those at or near the top in points per game:
1. Kevin Durant – 32.0 points per game
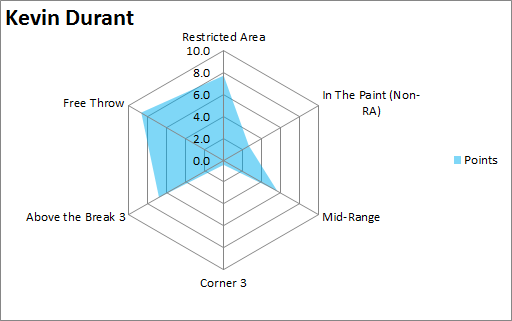
Points per location:
- Restricted area: 7.71 (14th)
- Paint (non-RA): 2.65 (21st)
- Mid-range: 5.66 (8th)
- Corner 3: 0.43 (209th)
- Above the Break 3: 6.82 (4th)
- Free throw: 8.69 (1st)
To get a feel for just how large Kevin Durant’s graph and others on this list really are, we can compare the league’s leading scorer to Kendrick Perkins’ graph because PERK:

Click to enlarge.
Perk’s looks minuscule compared to Durant’s, who’s just an offensive shark and in the top 25 in every category except corner threes. It might also be worth noting that just behind Durant in points around the rim per game is none other than Tony Wroten, somehow at 7.62 points per game and good for 17th-best.
As for three-pointers, I’m not sure how common this is and how often it’s been noted before, but Durant shoots better on pull-up attempts (42 percent) than catch and shoot ones (38.7), according to SportVU. Weird, maybe?
Onto number two in points per game:
2. Carmelo Anthony – 27.5 points per game

Points per location:
- Restricted area: 5.04 (76th)
- Paint non-RA: 1.20 (tied-108th)
- Mid-range: 8.77 (3rd)
- Corner 3: 0.52 (182nd)
- Above the Break 3: 6.08 (9th)
- Free throw: 5.92 (7th)
One of the more unusual charts I’ve looked at, Anthony gets a respectable share of points around the rim but he’s in the middle of the pack when compared with the top 10 in points per game. Ahead of him across the league are the likes of Timofey Mozgod, Alec Burks, and Tobias Harris. Melo also gets very little points from the corner three, but that’s common for high scorers with range.
As for the above the break threes, Anthony’s one of five on this list to crack the top 10 in points from that area of the floor. He also feasts at the line, another common theme with the top scorers.
What makes Anthony’s chart so odd is the mid-range game. This is the first chart where I’ve noticed both a great deal of points in the high-efficiency zones of the floor and the dead zones. Durant’s is like that, but not to the extent of Melo’s.
3. LeBron James – 27.0 points per game
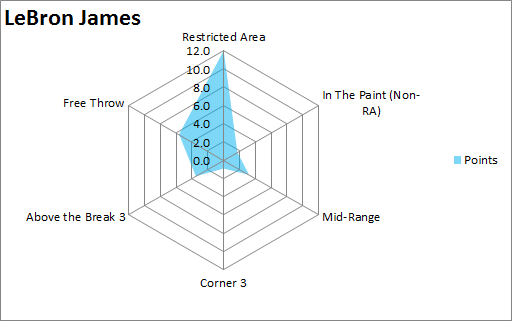
Points per location:
- Restricted area: 12.00 (1st)
- Paint (non-RA): 1.73 (60th)
- Mid-range: 3.20 (68th)
- Corner 3: 0.92 (108th)
- Above the Break 3: 3.52 (57th)
- Free throw: 5.64 (8th)
Confirmed: LeBron James feasts around the rim. He made me change the range on his chart to a max of 12 points per location, though a couple other players eventually did the same thing so whatever. His graph is a good example of an efficient one, though, and how it should show quite a few points on the left side. In fact, out of the top 10 scorers, James is the second-most Moreyball-like of the top 10 scorers in that 81.75 percent of his points come around the rim, from three, or from the stripe.
You might be able to guess who’s in first place on that list. Third place in that mentioned stat is…
4. Kevin Love – 25.8 points per game
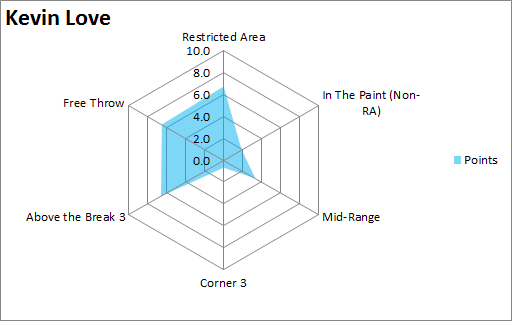
Points per location:
- Restricted area: 6.73 (26th)
- Paint (non-RA): 1.89 (47th)
- Mid-range: 3.35 (59th)
- Corner 3: 0.69 (144th)
- Above the Break 3: 6.61 (6th)
- Free throw: 6.51 (3rd)
Love’s the first player on this list to not lead or be near the top in averages from one of the first three shot locations. In terms of non-point guards in this list (eight players), he averages the least amount of points from those first few spots but still gets a decent amount from around the rim.
Love’s graph is the prototypical efficient kind anyway, confirming how he scores nearly 80 percent of his points either around the rim, from three, or from the stripe. The king of efficiency among this group goes to the league’s fifth-leading scorer, however:
5. James Harden – 25.3 points per game
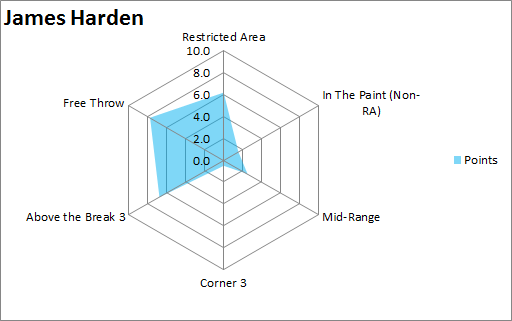
Points per location:
- Restricted area: 6.17 (37th)
- Paint (non-RA): 1.54 (tied-70th)
- Mid-range: 2.51 (89th)
- Corner 3: 0.51 (185th)
- Above the Break 3: 6.77 (5th)
- Free throw: 7.76 (2nd)
Nearly 85 percent of Harden’s points come from the spots that generate the most points per attempt, though he’s still in the top 100 in each of the least-efficient locations. He’s also the only player besides Durant to be in the top five in points from both above the break threes and free throws per game, though Kevin Love narrowly misses out on joining that club too.
6. Blake Griffin – 24.1 points per game
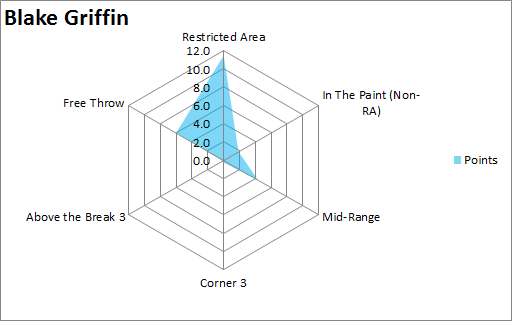
Points per location:
- Restricted area: 11.46 (2nd)
- Paint (non-RA): 1.87 (tied-49th)
- Mid-range: 4.33 (23rd)
- Corner 3: 0.27 (240th)
- Above the Break 3: 0.15 (tied-301st)
- Free throw: 6.00 (6th)
Just how many of Griffin’s points from the non-restricted area part of the paint are from either dunks or near-dunks that turned into double-pump layups? Regardless, we have our first near-triangular chart and the second player to score over 10 points per game from a single shot location. There’s also a smidge of blue crossing over the three-point areas thanks to whatever plays were drawn up to get Griffin a score from there.
7. Stephen Curry – 23.5 points per game
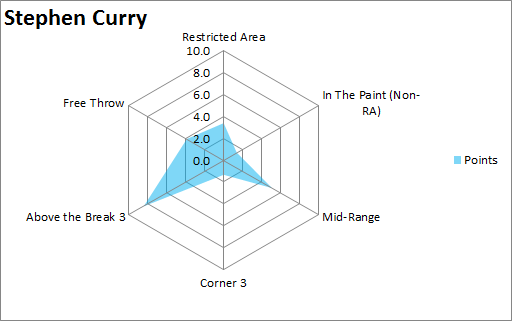
Points per location:
- Restricted area: 3.38 (137th)
- Paint (non-RA): 1.38 (86th)
- Mid-range: 5.11 (13th)
- Corner 3: 1.34 (63rd)
- Above the Break 3: 8.43 (1st)
- Free throw: 3.88 (31st)
Arguably the most unusual chart, in my opinion. Curry feasts from outside the paint, one of the stats worth noting being that he averages over one more point per game from the above the break three than third-place Damian Lillard. Ryan Anderson is in second-place at 7.8 but…sigh.
8. LaMarcus Aldridge – 23.3 points per game

Points per location:
- Restricted area: 5.70 (53rd)
- Paint (non-RA): 2.15 (36th)
- Mid-range: 10.96 (1st)
- Corner 3: 0.00 (Meh, tied for last)
- Above the Break 3: 0.13 (308th)
- Free throw: 4.33 (21st)
Maybe worth noting, maybe not: It took until Aldridge to get to a player who hasn’t made a corner three this season.
And that mid-range game. Aldridge looks like the least-efficient of this bunch as over half of his points come from the dead zones of the floor. In fact, while he scores a whole two more points from mid-range than second-place Dirk Nowitki, he averages nearly six more possible points (25.94 total for LMA) from that area than second-place Carmelo Anthony (20.00) in that stat. Unfortunately, he can’t make every one of those attempts and average nearly 40 points per game. Shucks.
9. DeMar DeRozan – 22.7 points per game.

Points per location:
- Restricted area: 4.29 (97th)
- Paint (non-RA): 2.13 (tied-37th)
- Mid-range: 7.42 (4th)
- Corner 3: 1.46 (51st)
- Above the Break 3: 0.91 (233rd)
- Free throw: 6.50 (4th)
Among this list, DeRozan’s chart is my favorite just from the shape his points form.
But, like Aldridge, it’s a bit of a weird one. DeRozan sits comfortably in fourth place in mid-range points, but he only makes a shade under 40 percent of his attempts. He does score the most points per game from the corner three among this group, however, and gets a decent chunk from the free throw line as well, more than the likes of Melo, LeBron, and Paul George, among others.
10. DeMarcus Cousins – 22.4 points per game

Points per location:
- Restricted area: 9.62 (6th)
- Paint (non-RA): 2.75 (16th)
- Mid-range: 4.03 (36th)
- Corner 3: 0.00 (somewhere in last place)
- Above the Break 3: 0.00 (take more threes, Boogie!)
- Free throw: 6.01 (5th)
The most triangular chart of the top 10 scorers, Boogie feasts in the paint, at the line and, um, sometimes from mid-range where me makes 41 percent of his attempts.
That triangle, though. It’s pretty neat, so there’s that.
Lastly, below is a GIF comparing each chart at once. It goes in the order of highest-scoring to the lowest:

All but Aldridge score at least half their points on locations in the center or left side of the graph. Harden’s chart seems to be the most efficient, though LeBron is just too effective around the rim. Regardless, it’s nice to see a variety of charts, especially the triangles. Don’t forget the triangles.
Any other thoughts are certainly welcome.
Tagged: Blake Griffin, Carmelo Anthony, DeMar DeRozan, DeMarcus Cousins, James Harden, Kevin Durant, Kevin Love, LaMArcus Aldridge, leading scorers, LeBron James, NBA, Stephen Curry

Reblogged this on xzach.
[…] 77 outings. To do that, I fiddled around with a variety of graphs I’ve recently used for the highest scorers and teams, among other related […]
[…] and a few other greats over their entire careers. The charts are the ones I’ve used for players and teams in previous posts, tracking shots on NBA.com from the restricted area, in the paint […]