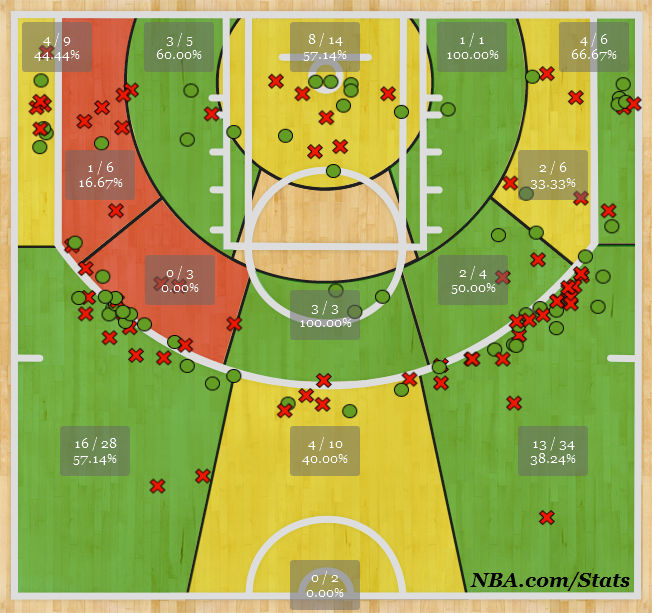
J.R. Smith’s shooting chart over his last seven games.
While the Knicks’ season is veering off a cliff, J.R. Smith has come out with guns blazing in each of his last seven games, for better or for worse. He’s been one of the league’s leading scorers during that stretch at 23.7 per, much of it thanks to emptying the clip from beyond the arc by attempting 12.7 threes per game (!!!) and doubling his total attempts for the season in just two weeks. This was all capped yesterday afternoon when he set the record for attempted threes in a game with 22, a decent summary of the Knicks’ season and something only believable if it happened to, well, Smith himself.
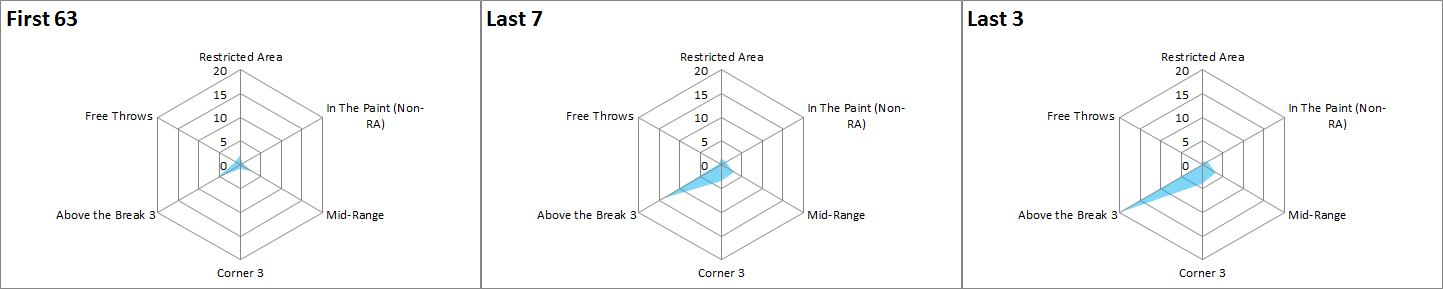
But while some of those attempted threes have been cringe-worthy, Smith’s shooting over the last seven games has averaged out to decent efficiency: Nearly 24 points per game on about 18 shots and shooting splits of 48.5/46.3/100. Beyond the arc is where Smith’s done most of his damage, and by fooling around with similar charts I’ve used to visualize point distribution for teams we can see the shift in Smith’s scoring from his first 63 games to his last seven and even last three where he’s averaging 29.3 points. (If only that kind of scoring were sustainable, for NBA Twitter’s sake.)
The first chart we’ll look at is point per location from the normal six areas of the floor: restricted area, in the paint (non-restricted area), mid-range, corner three, above the break three, and free throws. As an example, below is Smith’s point distribution per game through his first 63 outings:

Smith’s scoring weighed heavily toward the above the break three, for better or for worse, with nearly six points (5.62 to be exact) coming from that area of the floor. No other area gets as many as three points, with mid-range being the second most frequent scoring area at 2.86 points per.
Now, below features the graph previously mentioned along with his scoring distribution per game over his last seven outings and last three:
Click to enlarge. Quite helpful!
The very first chart provided shrinks considerably thanks to the max values provided to fit in Smith’s recent, unreal three-point barrage, and for the most part that’s all where he’s scored from. About three-fifths of his points coming from that scoring zone over his last seven games and two-thirds over his last three. The corner three and mid-range areas get some attention as well, but anywhere inside the paint and at the stripe has been mostly neglected.
Lastly, here’s a GIF of the increase:

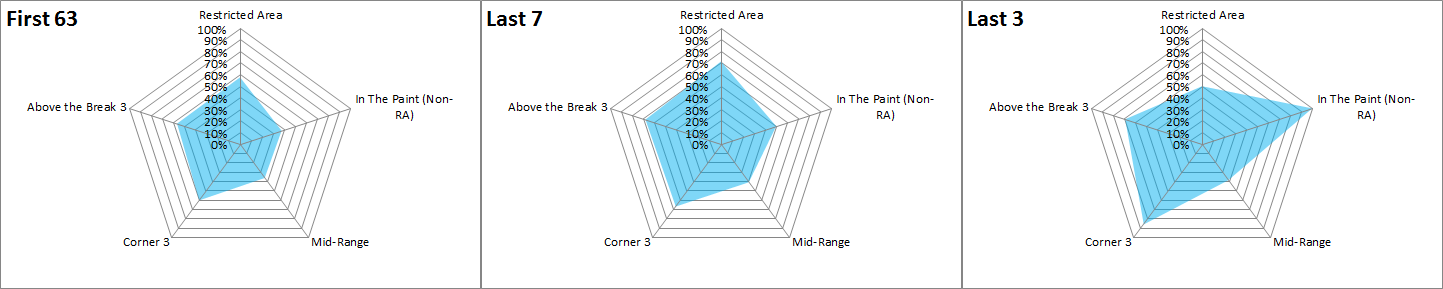
While Smith’s upped his three-point attempts, the uptick in usage from 20.8 in his first 63 games to 25.9 over his last seven hasn’t hurt his overall efficiency. In fact, during the recent stretch, Smith’s effective field goal percentage is 62.2 compared to a pedestrian 48.6 during his first 63 games.
Below hopefully shows that increase from five spots on the floor, minus free throw shooting. A reminder should be given that Smith’s shots recently have largely come from the perimeter. He’s only taken a combined two shots per game from the two areas inside the paint.
Click to enlarge.
And like with points per location, below is a GIF of the increase in EFG% across the three stretches of games:

Surely this isn’t sustainable, though there’s only four games left for the Knicks so we might see Smith lock and load until season’s end. New York doesn’t play another game until Friday anyway, giving him plenty of time to rest his shooting hand.
Edit: Previously, I mentioned that Smith holds the record for games with 10+ 3PA with four, but according to Basketball-Reference there’s actually a tie between multiple players for seven straight games of 10+ attempts. There’s still time for Smith to join that group as his streak is still alive, but for now he has a few games to go.
All stats are according to NBA.com.
Tagged: J.R. Smith, NBA, New York Knicks, shooting charts, sports, Stephen Curry, three point shooting

[…] – A crazy run of shooting for J.R. Smith means…fun with J.R. Smith shot charts! […]
[…] – A crazy run of shooting for J.R. Smith means…fun with J.R. Smith shot charts! […]
[…] – A crazy run of shooting for J.R. Smith means…fun with J.R. Smith shot charts! […]
[…] experimenting with point distribution charts for teams and with J.R. Smith’s shooting explosion, I thought it’d be fun to apply the same ones for the top 10 players in points per game this […]