Category Archives: Shot Charts

Dream Team #3 within the salary cap, Part 2–Bench

zzzzzzzz

This is part 2 of my dream team series and now my most pointless off-season post. That is, until the next post is published, and then the one after that, and…(for part 1, click here)

It’s a two-part series dedicated to the bi-annual construction of a team that doesn’t even exist (you can view past ridiculous squads here and here). I try to mix talent with cap-friendliness since I can’t go over the salary cap for any reason. This year, that limit is $63.065 million. All contracts are fair game, save for rookie deals. From there, I try to make the best roster to my limited abilities. This post covers the reserves. Below is a quick look at the starters I selected. You can find more regarding them in part 1:
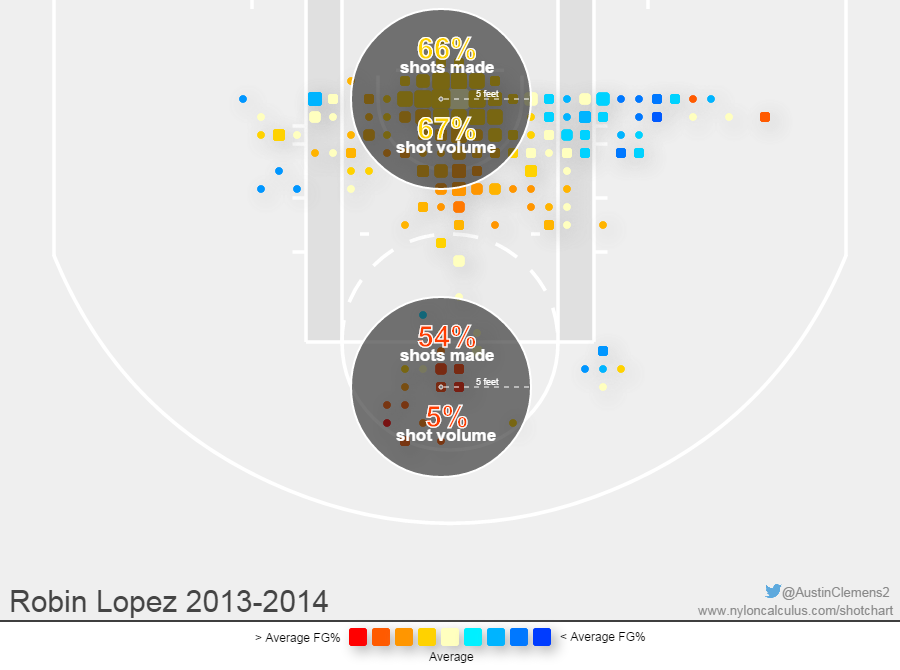
The starters combined for $49,397,823 which left $13,667,177 for the last seven players. That’s an average cap hit of $1,952,453 for each slot. Not great, not terrible. We can still splurge on a player who’s on a good, $5-9 million contract, and fill the rest of the bench with minimum deals.

So let’s get started. As a reminder, all cap hits are according to Spotrac.com. Shot charts are from Nylon Calculus.

#6: Goran Dragic, Phoenix Suns

  • Cap hit: $7,500,000

dragic 2014

I was lost on who to select. It felt mandatory to take Greg Monroe because of his qualifying offer, but I’m not sure a small ball center was best. Kyle Korver was another tempting player and I love his game, but he felt redundant with Dirk and Curry, Channing Frye would’ve made for some fun combos as a stretch-5, Wesley Matthews would’ve started but the extra few million impacted the options for this slot, and a few others were intriguing. For the sixth man I felt like I mashed buttons, clicked and prayed.

I settled with Goran Dragic. Mike Conley was another guard considered but, well, I don’t know.

Two words to describe Dragic, though, are electrifying and fearless, challenging behemoths at the rim even LeBron would shy from. Check out a couple of these moves against the Pacers:

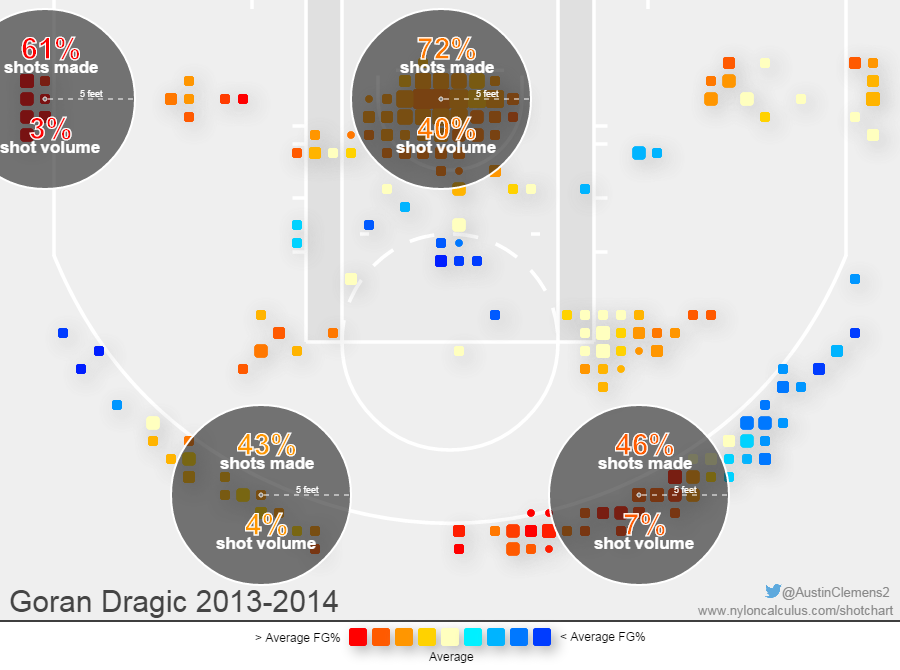
Imagine the pick-and-roll with either Nowitzki or LeBron after being so good with Channing Frye. Dragic is also one of the best shooters in both pull-up and catch-and-shoot situations. Just look at his shot chart overall. It’s so nice and balanced. He finished 2014 with a true shooting percentage over 60%, a rarity for a 20+ points per game guard with above-average usage.

Is that all coming back in 2015? The threes concern me the most. In 2012 and 2013, Dragic shot a combined 32.6% off 478 three-point attempts, and the spike in 2014 was aided by a higher dose of attempts from the corners. Only 18 guards, 6’4″ or smaller, have finished two seasons shooting 40% from 3 with a usage rate over 20%, so that doesn’t help, but plenty of great point guards have cleared those arbitrary benchmarks only once. It’s not terrible to decline to, like, 37%.

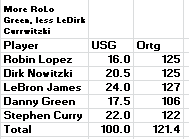
As you can see, though, I’m still talking myself out of this selection, and it’s weird that Dragic is coming off the freakin’ bench. It’s possible he’d in crunch time lineups. In part 1, I projected how many points the starters would score per 100 possessions, but let’s see what could happen if we plug in Dragic.

dragic lineups1dragic lineups2

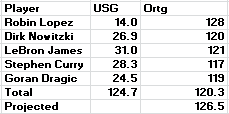
As explained in part 1, a study by Eli Witus years ago showed that a lineups’ offensive rating increases by .25 points/100 possessions when it has to decrease it’s usage 1%, and vice versa. Depending on the 5-man unit featuring Dragic, it made for projected ratings of 126.5 and 124.6. Both ratings are higher than the 122.9 points/100 possessions for the starting lineup.

Using Neil Paine’s model that combines not just Witus’ but Dean Oliver‘s work, let’s see how these lineups perform when adjusting for all the high-usage players (again, for further explanation, check out part 1). Here’s what they look like when shifting usage proportionally:

projected1 projected2

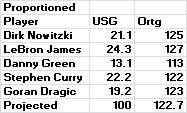
And now optimizing for the best projected points per 100 possessions:

optimized1 optimized2

Not quite the results expected from Witus’ study alone, but still 120+ points per 100, so, that’s okay. Danny Green’s offensive rating means he disappears when fiddling with usage, and hurts the bottom line of these units. I didn’t project numbers for any other 5-man combos.

Player #7: Shawn Marion, Cleveland Cavaliers

  • Cap hit: $915,243

marion 2014

I may or may not be depressed Marion is 36 years old. It makes this something of a gamble even on a minimum contract. I’m using a roster spot on him, after all.

Al-Farouq Aminu was available and offers rebounding, but on my imaginary team I’d rather take the guy proven to also make a corner 3 and fit in right away. Maybe that’s why Cleveland went with Marion too. Should his defense slide, that’s an issue, but this roster doesn’t need him to turn back the clock.

Player #8: Patrick Beverley, Houston Rockets

  • Cap hit: $915,243

bevs 2014

A bit weird to select both Dragic and Beverley, but I’m not too confident Beverley can hound point guards for 31 minutes like last season, so he’s going to be turbo-charged for like 20, or something. He’ll be a pest off the bench during the season, playoffs, and even the pre-season. Remember this?

Like Green and LeBron, he’s a one-man wrecking crew versus fast breaks.

I’m not the biggest fan of the Houston Rockets, but Beverley alone makes them watchable. Below are two places, either games or eras, where I wish we’d see him play:

  • The ‘90s. Beverley may not be the tallest, strongest, or greatest point guard, but can you imagine him playing defense with the freedom defenders once had?
  • All-star games. If voted in, I could see Beverley sucking the the fun out of next year’s festivities.

Offensively, Beverley is all right. Low-usage, high-efficiency, league-average 3PT%, and below-average finishing but the mid-50% around the rim isn’t terrible. His defense certainly propels him into a rotation.

Player #9: Troy Daniels, Houston Rockets

  • Cap hit: $816,482

daniels 2014

Like Beverley, Daniels is a role player who should make the Rockets entertaining. I look forward to seeing what kind of looks Harden gives him with two seconds left on the shot clock.

Undrafted with only five NBA games (shot chart is from the D-League), Daniels is still a solid candidate to become one of the best shooters. In the D-League, he attempted 12.5 threes PER GAME and made 40% of them. Even the ‘meh’ areas in his chart look good. When he and Curry are on the floor, either on my fake team or against each other in real life, threes will be hoisted and fire will be made.

My backcourt is crowded. Finding minutes for Daniels will be tricky. Now to forwards and rim protectors:

Player #10: Cole Aldrich, New York Knicks

  • Cap hit: $915,243

Cole  Aldrich 2014

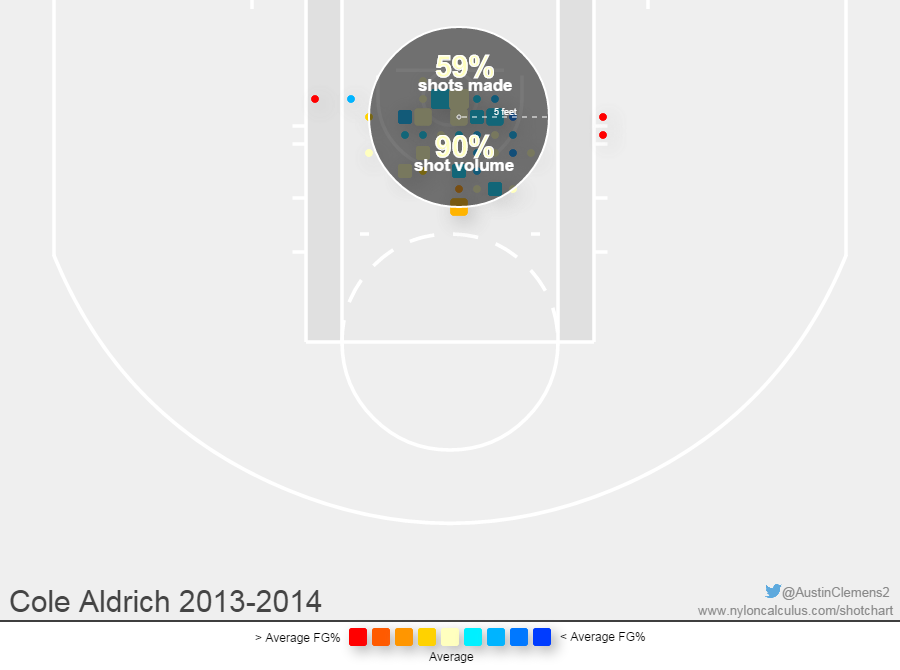
I can’t believe I’m doing this, but I’ll admit Aldrich wasn’t so terrible as a backup for the Knicks.

When looking at per-36 numbers, Aldrich cracks the top 20 in Seth Partnow’s rim protection stats. He also grabs defensive rebounds like crazy, snatching 33.8% of all missed field goals while on the floor, and he blocked 4.8 shots per 100 possessions all while not looking like the hack he was in previous seasons with Oklahoma City, Houston, and Sacramento. He finished 2014 with a PER of 19.1.

The problem is that he’s rarely played, only logging 1,033 minutes over four seasons. In 2014, a good load of it was in garbage time versus fringe-rotation players. 60% of his 330 total minutes came in the fourth quarter and 70% while up or behind by double-digits, per NBA.com. Hopefully the Knicks take a closer look at what they might have in Aldrich, but if he wants to converse with Jose Calderon about human ham, that’s fine too. I selected another potential rim protector in case that happens.

Player #11: Ed Davis, Los Angeles Lakers

  • Cap hit: $981,084

ed davis 2014

The Lakers and their pull when it comes to minimum deals continues, as Davis is a nice third big deserving of a larger check. Hopefully he doesn’t get buried behind Carlos Boozer, Jordan Hill, and Julius Randle. The Lakers’ frontline is quite crowded.

Like Aldrich, Davis was a lottery pick in the 2010 Draft and probably expected to be a larger contributor by now, but let’s not confuse the two. He has a career sample size 5x as large and just barely missed 1,000 minutes with an OREB% and DREB% of 10 and 20, respectively. He’s long and rangy, an active defender, though with more important minutes under his belt he doesn’t hold up well in the same rim protection stats as Aldrich. His build also means he gets pushed around, but it also helps him move well for someone in that 6’10”-6’11″ish range.

Playing Davis with LeBron, Beverley, and either Lopez or Marion would be interesting defensively.

Player #12: Jon Leuer-Durant-Chamberlain-Jordan***, Memphis Grizzlies

Cap hit: $967,500

Leuer 2014

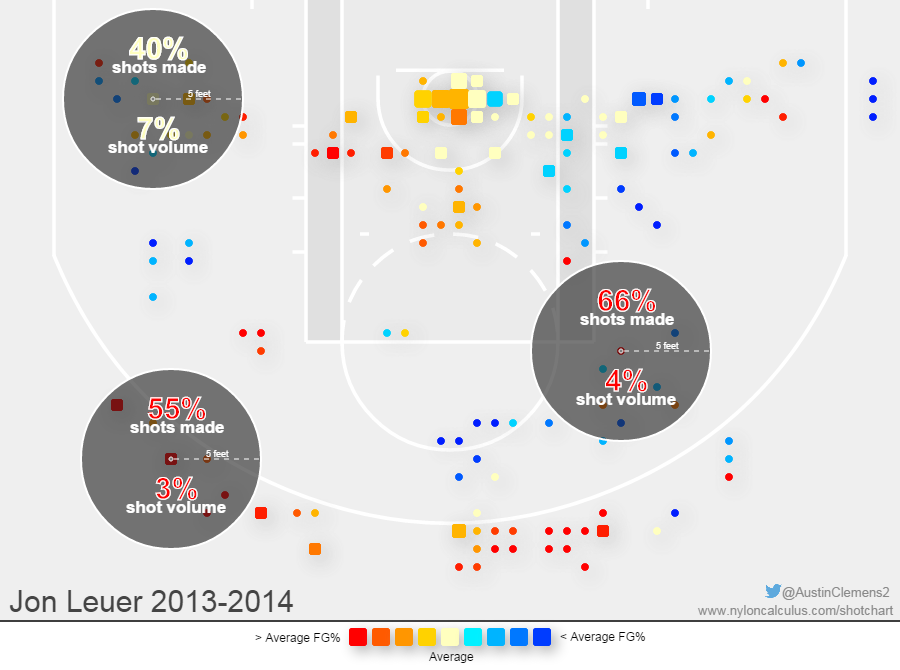
Saving the best for last, Leuer is the greatest player I’ve ever seen. He’s Memphis’ Kevin Durant, only better. Unfortunately, Leuer took only 49 threes last season, and defensively he doesn’t look too hot in a few all-in-one metrics. Hopefully he’ll be more consistent next year. Up to this point he’s played just 123 games and 1,384 minutes. Leuer needs to stop screwing around and take over the league already.

***This was a lame attempt to get Jon Leuer a nickname on Basketball-Reference.

So there’s my 12-man squad. Below is a similar stat summary as in part 1, but with all the players. Click to enlarge because holy hell that looks blurry.

team overlay

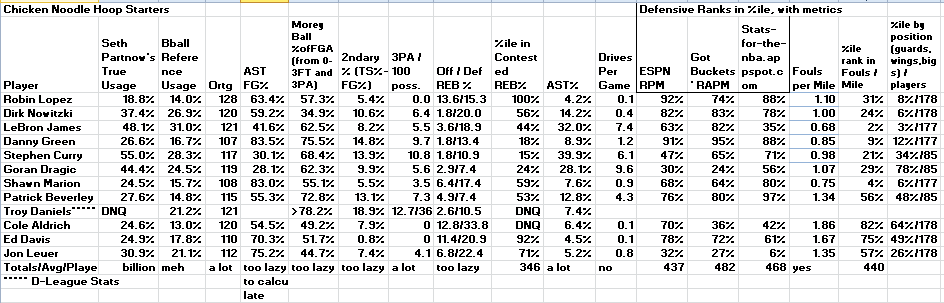
Among other things, this is an efficient scoring bunch. Those that take more than a few mid-range shots (Curry, Nowitzki, LeBron) are either good to great at them. Also, look at Daniels’ secondary percentage. It’s from the D-League, sure, but that would flirt with the best marks in NBA history.

As for defensive metrics, they don’t look too bad for this team. It’s kind of embarrassing where Leuer ranks among the league, though, and all of my backup bigs are hacky. Walking fouls, literally.

Below is a breakdown of player salaries and how close I came to the cap:

team salary

The total salary of my roster left me with over $650,000. I spent $100,000 on a lifetime supply of waffles and used the rest to sign a 13th man. Like Leuer, the player I chose is a legend in the making:

Player #13: Sim Bhullar, Sacramento Kings

  • Cap hit: $507,336
embiid chart

Projected shot chart

This team would rule planet earth.

Honorable mentions:

Center: Pau Gasol, Omer Asik, and Channing Frye.

Power Forward: Nick Collison, Amir Johnson, Ryan Anderson, Greg Monroe, and Jeff Adrien.

Small Forward: Richard Jefferson, Paul Pierce, Kyle Korver, and Vince Carter. 

Shooting Guard: Arron Afflalo, Leandro Barbosa, Francisco Garcia, Alan Anderson, Wes Matthews, and Jamal Crawford.

Point Guard: Jose Calderon, C.J. Watson, Pablo Prigioni, Mike Conley, Jameer Nelson, and Qualifying Offer Eric Bledsoe

And any others who flew over my head.

Advertisement

Dream Team #3 within the salary cap, Part 1–Starters

zzzzzzzz

Let there be no cap or CBA (CDA?) on your dreams.

The deadest part of the off-season is here, but soon there will be #MuscleWatch, training camp hype, hopefully the disappearance of rankings, and eventually buzz around pre-season performances. We’re almost to the 2014-15 season, and good lord it can’t come fast enough.

There’s still enough time to write posts that are pointless like this one, about a team that doesn’t even exist: My dream team within the salary cap. It’s a series I started last pre-season with a revised squad over the all-star break. This year I’m not patient, posting a month earlier than last year, but all major contracts are signed save for Eric Bledsoe’s. His would actually alter the roster if he took a $3.7 million qualifying offer. It’s disappointing that, despite writing at a slothful pace, there’s little chance any Bledsoe news will explode before part 1 of this series is published. (Edit: I was sort of wrong.)

But yes, there are not one but two posts for this team. Part 1 covers the starters, part 2 the reserves. The guidelines for selecting this team are fairly simple. Make a 12-man squad without exceeding the 2014-15 salary cap of $63.065 million. Rookie deals are off-limits, but I don’t feel the same about minimum deals or exceptions since I can’t go over the cap in any way.

Some notes before I rattle off my starters. I’ll expand on these later:

  • I don’t think this is the best roster I could put together, mostly because of my math skills and overall intelligence of the players in my made-up, cap-friendly player pool. I give the team a B+.
  • Only one of LeBron James and Kevin Durant made the team. I WILL TRY TO EXPLAIN THIS.
  • Cap hits were via Spotrac.com. Many of their contracts match Basketball-Reference’s, though they are up to date with recent signings across the league. Don’t worry, B/Ref. I still love you.
  • I’ve never went back and forth with so many players. A few slots were chosen at the last second.

On to naming the starters, each with a Nylon Calculus shot chart. Austin Clemens for off-season MVP!

Center: Robin Lopez, Portland Trail Blazers

  • Cap hit: $6,124,728

Lopex 2014

Timofey Mozgov was the center for the longest time, even in some projected lineup stats until I caved with Robin Lopez. Mozgov was $1.5 million cheaper, cracked the top 35 in Seth Partnow’s rim protection stats, and held up in a few all-in-one metrics. He was also productive as last season came to a close, averaging 14 points and nine rebounds in 27 minutes over the final 16 games. There were also flashes of becoming a stretch 5. Well, sort of. Regardless, Mozgov should be the Nuggets’ starting center rather than JaVale McGee or the out-of-position J.J. Hickson.

But I went with Lopez, on the team a second straight time. Here’s a video of him kicking some ass:

He doesn’t have the silky smooth 3-pointer Mozgov possesses, but he’s one of the very best rim protectors and holds up better in the same all-in-one metrics. He also used only 14% of possessions last season while on the floor, often with one of the most potent starting lineups in the league. Sure, Lopez will make an awkward hook shot, maybe swish a mid-range jumper or make teams pay for fouling him with a free throw percentage surpassing 80, but for the most part he’ll bang with opponents, protect the rim, and get boards. He actually led the league in contested rebound% and would be a terror on the offensive glass if his defender sags off him and helps against any of the high-usage players I chose.

Lopez can also log more playing time than Mozgov, finishing last season just over 30 minutes per, and he’s durable, missing only two games the last three years. Mozgov has yet play the same major minutes over a full season, but 2014-15 could be a year when he clears those benchmarks.

Power Forward: Dirk Nowitzki, Dallas Mavericks

  • Cap hit: $7,974,482

Nowitzki 2014

In 2014, Nowitzki recorded a career-high in eFG% and a 3-point rate not seen since teaming with Steve Nash. With a pay cut that will last through possibly 2017, he might be in this series for a while.

The higher 3-point rate makes sense when Nowitzki is 36 years old, and combined with a declining free throw rate he’s a glorified role player on this squad. He can still create and his assisted field goal rate on made two-pointers (50%) resembled what we saw during his prime. The shot chart is fire overall and Nowitzki’s mid-range game generated about the same efficiency as a league-average three-pointer:

ian2

Maybe Nowitzki would be like 2011-14 Chris Bosh, but the holes he can drill in a defense just off the ball would open a ton of room for younger, springier players I selected.

Defensively, it’s possible Nowitzki could be hidden thanks to another forward I chose, one with height and strength to play the ‘4’ in doses, but this squad was made to outscore than lock down. It looks like both Lopez and Nowitzki would hang back in pick and roll coverage.

Small Forward/Utility – LeBron James, Cleveland Cavaliers

  • Cap hit: $20,644,400

leBron 2014

I still can’t believe I can type LeBron James, Cleveland Cavaliers.

If I had to, I’d fit both James and Durant on this team, but together they take up $40/63 million in available cap space and, while it’s tempting to go top-heavy with this roster, a LeBron-Durant-Nowitzki/Curry trio with nine minimum contracts isn’t as fun a roster to write about as one with depth. We don’t yet know who the injury bug will bite anyway. In the all star break-related post, I might go with a huge 3, but this off-season brought nice, still-healthy bargains.

This wasn’t an easy choice. Durant was about $1.5 million cheaper, and that million or two saved for each slot adds up. He has more range, should be a better defender next season, and can carry a higher scoring load with less long-term effects. He might also improve on his assist rate, and, who knows, he may play more power forward and add a clever post move. Durant may very well repeat as MVP.

I wondered if he was the best fit with all the other shooting I plucked. To get the juiciest looks at the basket, somebody needs to consistently bend the defense and LeBron can do just that, able to get to any spot. Durant isn’t at that level partly thanks to a slimmer build. Pesky defenders take advantage of that. It looks like LeBron will be bit slimmer this season, though, so we’ll see how that impacts him.

LeBron is as positionless as it gets, and if not for the slip in defense is as perfect a player as could be, but his defense has slipped. We’re probably at the slight downturn of his career, and if this team was made for five years versus one, I’d flip-flop my choice for small forward. Regardless, this is LeBron’s third straight appearance here, and if it’s in his diet he should celebrate with a ham sandwich.

Shooting Guard – Danny Green, San Antonio Spurs

  • Cap hit: $4,025,000

Danny  Green 2014

Green is third to repeat here, on the first team before replaced by the ~$900K salary of P.J. Tucker.

He is by some metrics the best 3-and-D shooting guard in the league. Here is one via Tom Haberstroh:

BxqcpnqCQAEqFn0

3-and-D players are an essential piece to any winning team, but especially one with three high-usage players who aren’t elite defenders for long periods of time. Green would take on the toughest defensive assignments, though it wouldn’t exactly be ideal to have him chasing point guards.

With both Green and LeBron, that’s a fantastic fast break defense with the chase-down block for LeBron and Green consistently anticipating angles below the rim to bottle up the strongest of players. Even his flybys tend to happen at the perfect moment. Below is a video showing some of this:

Some on/off fast break stats for Green are pretty interesting. Opponents scored 1.1 less points per 100 possessions when he was on the floor and two less points after all turnovers, per NBA.com. The difference in the former stat would’ve bumped the Spurs from 11th in the league to the top five while the latter would take them from eighth to behind only the Hornets who were in a league of their own.

It’s also worth noting Green has never fouled out in his short career, and the five-foulers are nearly as rare. Some of this is helped by minute totals, but the Spurs organization should also get credit.

Now to Green’s offense. According to Basketball-Reference, 75% of his shots came within three feet or beyond the arc where he shot 69.8% and 41.5%, respectively. He’s a limited scorer, though, an adventure when dribbling despite a solid pull-up shooter, and only shot 35.8% from the corners. That corner 3P% might be an outlier when the past two seasons were 45.1% and 43.3%, respectively, and ~36% is fine anyway. Sometimes that and ~55% around the rim is criticized too harshly.

Despite Green’s limits offensively, he has a history of explosive performances in high-pressure games. Hopefully someday my point guard gets a really deep postseason run so we can say the same for him.

Point Guard – Stephen Curry, Golden State Warriors

  • Cap hit: $10,629,213

stephen curry 2014

Many of the best shooters need a teammate to bend the defense before being fed an attempt, and what better teammate to do that for Curry than LeBron? But Curry can do it by himself, something similar to what Ian Levy wrote about recently. Curry not only demands attention off the ball, but defenses shift to his movements on the dribble as well. He can get shots off anywhere with the smallest of spaces to work with, either with some crazy dribble combinations or off the catch.

Curry’s flamethrowing makes him a one-man offense for stretches, his heat waves sometimes more like…tsunamis? He’s somehow taken over 1,200 threes the last two seasons and made 44%. For this team, he could carry bench units, playing off the ball when alongside LeBron, but it would be something of a waste to not unlock his on-ball shooting in stretchy, starter-heavy lineups.

How good could Curry be alongside, say, Nowitzki? We could look at his shooting alongside a stretchy forward like Draymond Green instead of David Lee. With Green on the floor, Curry shot 50% from three compared to 38.6% with Lee, according to nbawowy.com, and hoisted 11.9 threes per 100 possessions with Green compared to 9.5 with Lee. Overall, his usage increased from 26.2 to 31.4. This isn’t meant to blame Lee’s limitations for Curry’s drop in those stats, but stretch and space matters for all positions.

With all the scoring in this lineup, Curry would still take a backseat some of the time. Not the worst thing in the world since he, like Durant, is on the slimmer side with some of the same problems with pesky defenders, and he can be turnover prone. In particular, he sticks out quite badly in this passing chart I made a while back. Regardless, he’s only 26, and it’s not at all bold to claim he’s the best shooter alive. Soon he might also be the best point guard in the league.

Some Stats

So this is how the starters stack up in a variety of numbers (click to enlarge):

starters overlay

Every player played for very successful offenses last season, minus Curry. There’s a mix in usage, some are slashers and others high in assisted shot %, and most hold up well in all-in-one metrics. It also looks like my starters will never commit a foul.

Obviously most stats would change, for better or for worse, if these players were together. Most obvious might be Basketball-Reference’s usage rates since, together, this unit would have to top out at 100%. That would actually help the projected offensive efficiency. Right now, without tinkering with the usage, the points per 100 possessions balance out to a whopping 118.6, 6.5 more than the 1st-place Clippers last season. That number would only improve as the lineup is forced to use less possessions, according to a couple notable people.

Some time ago, Eli Witus found the following related to lineups and usage, among other super interesting things in his study: “In general, for every 1% that a lineup has to increase its usage, it’s efficiency decreases by 0.25 points per 100 possessions, and vice versa.” It’s a bit harder and probably pointless to project a lineup of five guys who weren’t teammates last year, but under Witus’ study this lineup go from scoring 118.6 points/100 possessions to 122.9. We can tack on an extra point or two with amount of three-point shooting provided from four of the five players.

A couple years later, Neil Paine created a simple lineup efficiency model that combined Eli’s and Dean Oliver’s findings, the latter super intelligent guy making a distinction between low-usage, mid-usage, and high-usage players. Adjusting Paine’s model to 2014’s league-average offense, we get the following tradeoffs in offensive rating for increasing or decreasing each of my starters’ usage rates by 1%:

usage type


So I tinkered with the players to find their offensive ratings if their usage rates were anywhere from 10 to 40%. As usual, click to enlarge:

graph22112

With the low-usage, Lopez and Green dive harder than the big 3, but Lopez’ offensive rating gives him a head start. Nowitzki and Curry are neck and neck while James, as expected, is in good shape.

So we can use that info while tinkering with the lineup’s usage rate to see if we can reach the projected 122.9 points/100 possessions. The first adjustment is what would happen if we proportionally shifted every player’s percentages to a total of 100%:

proportioned starters


Not bad, and somewhat close to the previous projection of 122.9, but keep in mind the usage rates of Lopez and Green. What if each player was at 20%?

20 everyoen


The offense still improves from the 118.6 we started with. You can tinker quite a bit until the offense falls off the rails:

more rologreen rologreen

The best scoring projection involved Danny Green getting the shaft, thanks to his lower offensive rating last season, and Lopez’ usage actually increasing from 2014’s total:

optimized

That comes pretty close to what Witus’ study would suggest this lineup would score, but I can’t see those usage rates actually happening for a bunch of reasons. It would involve Green passing up what’s probably a few juicy looks from the arc, specifically from the corners since he’s the least versatile shooter, and those shots need to be taken. Who knows, though. Maybe he just never commits a turnover. As for the other players, it’s probably not ideal for LeBron to use over 27% of possessions and Dirk about 25% for an entire season.

So those projections might’ve been iffy, but the starters are a decent blend of players. Lopez and Green are already two of the best low-usage complimentary players out there, both providing some nice defense in the process. As for the trio, Curry and Nowitzki’s skill sets allow for a seamless transition into second and third options while LeBron, despite in his 12th season already, should be just fine.

The rest of the roster will be explained in part 2.

Honorable mentions (some players made the reserves, most didn’t):

Centers: Timofey Mozgov, Channing Frye, Omer Asik, Serge Ibaka, Al Horford, Tim Duncan, not Andrea Bargnani, Pau Gasol, and Boris Diaw.

Power Forwards: Kevin Love, LaMarcus Aldridge, Blake Griffin, not Amar’e Stoudemire, Greg Monroe, Kevin Garnett, Amir Johnson, Ryan Anderson, Paul Millsap, and Boris Diaw.

Small Forwards: Kevin Durant, not Gerald Wallace, Paul Pierce, Kyle Korver, and Boris Diaw.

Shooting Guards: Wesley Matthews, not Kobe Bryant, Vince Carter, Arron Afflalo, and Boris Diaw.

Point Guards: Goran Dragic, not Deron Williams, Mike Conley, the unsigned Eric Bledsoe, and Boris Diaw.

And all other players that are cap-friendly (or not) who flew over my head.

Charts for the players above average from everywhere, via Nylon Calculus

My last post went over the players above-average in attempts/36 minutes from each of the basic shot zones plus free throws. HOWEVER, with the updated shot charts by Austin Clemens over at Nylon Calculus being so great and all, I decided to make a gallery with those charts too.

As a reminder, below are the players that will be featured and the seasons when they made the cut. For example, 2.00 for a shot location means they took twice the player average for attempts per 36 minutes. It’s not sorted by position or pace, unfortunately, but I like to think it’s interesting. For more info check out that post:

And now, their charts in alphabetical order:

This slideshow requires JavaScript.

From my judgement, based on the charts 16 of the 46 featured a player favoring the opposite side of their strong hand, like a right-hander showing more than ~60/40ish activity on the left side versus the right. 13 of those were righties shooting much of their shots from the left side with Gary Payton‘s being some of the most lopsided. 2004 Michael Redd was one of the four lefties.

22 looked balanced (2005 Gilbert Arenas, for example) while the last seven favored the side that goes with their dominant hand. 2003 Vince Carter was one of those guys. He actually made each category, but that’s a bit easier when having four seasons on the list.

The players above average in attempts from everywhere

Lately I’ve fooled around with player field goal attempts per 36 minutes, but mostly from a specific shot zone and compared that to the player average by dividing by it. While it’s a statistic I’ve yet to filter by positions, it should still have some value (as you might have noticed on Twitter if we’re friends on there). It’s weird that it’s rarely cited if at all when we sometimes compare a player’s shooting percentages from shot zones with the league average, even though that has its flaws too.

One reason could be be that the player average of attempts/36 minutes is a stat that’s probably hard to find and, at least for me, takes a little bit of time to calculate. Taking that into account and since it’s a key part of this post, it’s probably helpful to post a breakdown of the player averages from each shot location from 1998 to 2014. Numbers were calculated about a couple months ago from NBA.com, and the chart is interactive so sort, filter, even type into the chart if you’d like:

We can use those averages for silly things like to see if any player over the last 17 seasons took an above-average amount of attempts/36 from every shooting location and from the free throw line. As you might’ve guessed from the title, that’s what I did here. With the minimum minute total set at 1,000 for every season except 1999 (set at 600 minutes) and 2012 (800), 46 made the cut out of a possible 4,296. Quite a few players made repeat appearances.

Below is the list where I divided their attempts/36 minutes by the player average that season, so for example if a player’s above the break 3s spat out a number of 2 or higher, it means they took at least twice the player average of above the break 3s per 36. The table itself is ordered by years but the chart should allow for sorting and filtering. You can also find a player’s per-36 numbers in a second sheet:

There are definitely some odd names on that list. Among them: 2009 John Salmons, 2012 Jordan Crawford, 2004 Tim Thomas, even last season’s Jeff Green. Those guys narrowly made the cut. Some more expected names are probably Allen Iverson, the early to mid-2000s Vince Carter, the first Shaq-less year of Kobe Bryant, the rise of LeBron James, and, of course, Toni Kukoc.

Just about all players were comfortably above the player average in attempts/36 from the above the break 3. I suppose this isn’t surprising since most centers bring the average 3PA/36 down and wings were likely impacted negatively when it came to filtering shots in the two zones inside the paint. Again, adding a position filter is a project before next season.

Overall, though, the corner 3 was the biggest dealbreaker when filtering out players who didn’t take the average attempts from a certain spot. Below is the number the list grows to if we take out the filter from each location and minutes, along with some notable players who would then make the cut:

  • Restricted Area: 113. So much Ben Gordon, Jamal Crawford, Kevin Martin, and Ray Allen. Also 2003 Rasheed Wallace.
  • In the Paint (Non-RA): 87. Some random names but also lots of Jerry Stackhouse, Paul Pierce, Peja Stojakovic, and Stephen Jackson.
  • Mid-Range: 75. Nobody from the recent Rockets squads show up, but Manu Ginobili and Antoine Walker make multiple appearances. Also much more Gary Payton.
  • Corner 3: 147. Basically every season from Iverson, Bryant, and LeBron.
  • Above the Break 3: 65. Shareef Abdur-Rahim, Luol Deng, and 2014 Evan Turner.
  • Free Throws: 60. Lots of randomness: 2005 Keith Bogans, 2007 Randy Foye, 2003 Rodney White, 2008 Willie Green, and 2013 Michael Beasley.
  • And also minutes: 56. Lester Hudson (!!!).
  • If we even made every filter 90% of what it normally was (minutes included): 137. Lots more Antawn Jamison, Metta World Peace, and about every 2004-2010 season of Michael Redd. Also included would be 2014 Goran Dragic.

Something else worth noting is how rare something like this is happening over the last half-dozen seasons. A thought on why: The change in the shooting guard and wings overall. Looking at some of the teams those players were on, it’s also understandable a few had carried a significant load of the scoring.

Overall, the last six seasons make up 35% of the time between 1998 to 2014, but the players from that span make up only 21% of the list. Nearly half of it comes from 1998 to 2004, though quite a few players are repeats. If we took out the free throw filter (which felt kind of unfair to begin with), the ratio of players from 2009 to 2014 and 1998 to 2014 is nearly the exact same.

Going forward, I actually thought Paul George was a strong candidate to join this list in 2015 despite a likely decline from the corner three, but unfortunately we know now his campaign won’t happen.

Lastly, below are radar charts visualizing the stats in the two sheets previously listed. I also tried to make the axis on each chart as consistent as possible but exceptions were made for one player. The galleries below are probably on auto-play, but they should be fairly easy to toggle through. There’s even a little animation between each screenshot. Hopefully they’re not ridiculous:

Player’s FGA per 36 / Player Average FGA per 36 (sorted alphabetically)

This slideshow requires JavaScript.

Player’s FGA per 36 ( sorted alphabetically)

After charting a players’ attempts per game for a while, you get to see what kind of players take on certain shapes. For the high-usage, high-scoring player, the shape is often what is seen here: A…stingray? Sometimes it’s a fat one or whatever.

This slideshow requires JavaScript.

All stats are from NBA.com. Not expecting these to be shared, but if you’d like to share those charts please either link back to this post or give some kind of credit involving Chicken Noodle Hoop or my name. I know both are weird to type out or say out loud, but it would be greatly appreciated. Thanks.  

Career shot and point distribution charts: Ray Allen

BorLez8CAAERt9c

Lately I’ve been getting back to looking at shot and point distribution charts, ones of players still in the Finals and a few other greats over their entire careers. The charts are the ones I’ve used for players and teams in previous posts, tracking shots on NBA.com from the restricted area, in the paint non-restricted area, mid-range, corner 3, above the break 3, and free throws, but I’ve recently added a few more charts to the mix. This post is basically a trial version of them with Ray Allen’s being the ones tested, and if it turns out all right I might turn it into a blog series over the off-season.

There will probably be some tweaking to do, but for now I plucked Allen’s yearly numbers from NBA.com which somehow has shooting stats and charts starting not at 2001 but 1997, though I don’t consider the ones from ’97 to be all that accurate thanks to the shortened three-point line back then. We get to work with every other season of Allen’s career, though, and maybe other notable players from the late-90s to today.

In past posts, I included GIFs and/or screenshots to show changes in charts from each season, player or team, and while I’ll use each of those for this post I’ll also use galleries so readers can cycle through charts at their own pace. The galleries also provide a little animation between each season to help show shifts in shooting and scoring.

Hopefully all of that isn’t confusing, but I can be pretty lazy with explaining things. For those who haven’t looked at these kinds of charts before, maybe just looking at them is easier to understand anyway.

Allen’s attempts over his career from both the field and the free throw line were what I looked at first, and below is an example of the four different charts I made for that section. This one is from 1998’s available stats:

1998 rayface

My apologies if screenshots look a bit blurry. They look much sharper when clicking to enlarge.

The first 3 charts are mostly similar with FGA distribution missing free throws, of course, but that one and attempts per 36 minutes compliment Allen’s first chart (attempts per game) best in his later years when his minutes and total attempts decline.

The last chart, attempts per 36 minutes compared to the player average, is something I’ve recently been playing with, though it doesn’t adjust for pace. In 1998, Allen took nearly six mid-range shots per 36 minutes, but compared to every other player’s numbers it was more standard than his attempts from the corner three, where he took twice as many attempts/36 minutes as the average player. This is a pretty common theme over Allen’s career.

Below are the rest of Allen’s attempts in a photo gallery. It should be on auto play, so I guess in way it’s still a slow-moving GIF, but it can be paused any time:

This slideshow requires JavaScript.

Where Allen shoots from each location has obviously changed over the years, once heavy on mid-range shots and almost always making a ton of either above the break threes or corner threes compared to the player average.

Below are the differences between his second and 18th season of his career (1998 and 2014):

1998-2014 rayface

Allen still takes a similar amount of above the break threes per 36 minutes as he did in 1998, but now he attempts about 3.5 times as many corner threes, half the free throws and shots in the paint (outside the restricted area), a third from mid-range, and about three-fifths as many around the rim. It also shows how three-happy the league has become with Allen’s above the break 3s/36 minutes more standard now than compared to the late-90s.

Some of Allen’s changes are consistent with how his FGA distribution has changed with each team. Below is a GIF putting his combined point distributions for each team together (click to enlarge):

Allen on Make A Gif

Along with the roster around him, age most likely contributes to Allen’s shift in FGA and FGM distribution. With the Heat, it also changes a bit when he’s in lineups with or without LeBron James:

ray w-o lebron


I also looked at Allen’s biggest changes in FGA distribution from season to season, basically by a simple subtraction of percentages. I took 1998’s percentages and subtracting them from 1999’s, for example, then made every change in percentage positive and adding each location’s numbers up.

This is what each season looks like, sorted by biggest total changes to smallest:

ray fga change overall

Visually, that looks correct when looking how the largest and smallest changes stack up (as usual, click to enlarge if you’d like):

ray fga change large 2010-11

Allen took more of his attempts from mid-range in 2011 despite having a fourth straight decline in usage rate, but he also took a higher percentage of his attempts from the corner three and, as shown much further down in this post, he was way more accurate there than in 2010.

Mid-range and non-restricted area paint attempts are the biggest differences in 2004 and 2005, but everything else looks the same otherwise. When comparing changes in Allen’s FGA distribution in 2003 before and after the trade that sent him from Milwaukee to Seattle, his chart hardly moves and would be the lowest compared to season-by-season changes, totaling to a 6.53% change. (Threes were a different story. More on that later.)

Simply subtracting doesn’t take into account the shots Allen takes least (depending on the season, either corner threes or in the paint non-RA shots) and most (either shots around the rim or above the break threes). It’s often a bigger deal if a player or team takes five percent more of field goal attempts from the corners than around the rim, and I tried a couple ways to balance for that but hit snags since they’d be hopeless if Allen (or any other player, or team) took zero percent of their shots from one of the five locations. Also, I’m terrible at math and maybe over-thought the whole process, so if there’s an easy way to calculate that stuff I’d love to hear it since I’m looking into shooting and scoring by teams over each season, among other post ideas.

To go back to mid-range and other two-point shots, though, it may or may not be surprising that Allen took as many as he once did, though that can be said about the league as a whole. Mid-range shots made up a great chunk of Allen’s shots for a long time, and about 20 percent of his attempts as a member of the Heat still come from that area of the floor, but that’s down from what was anywhere from 25 to over 40 percent as a Buck, Sonic, or Celtic.

Looking at his shot charts at NBA.com that split into several locations, less of his twos come from the wings now than they did as a Sonic or Celtic, but there’s still a similar amount from the baseline where, for most of his career, Allen took the most of his jump shooting twos.

Below is a breakdown of Allen’s 2PA distribution according to spots on NBA.com’s shot charts. I gave locations names that are hopefully self-explanatory, but can be found here just in case:

2pa dist

As usual, click to enlarge. Very helpful!

Allen’s baseline shots are the standard ones from being run off the three-point line and getting separation off screens, but quite a few come from trying to get space off the dribble when the shot clock is winding down. He doesn’t get all that far, painful to watch when he was once so good at attacking off the dribble (one example here), but he doesn’t need much space to get his beautiful shot off anyway.

Even if Allen seems to struggle a bit more in getting to the rim off the dribble, he’s still having career-lows or near career-lows in attempts/36 minutes from all the 2PA locations on NBA.com’s shot charts all while having a career-high in corner three-point attempts/36 minutes and percent of his FGA being corner threes. His mid-range shots/36 minutes have gone from around or above league-average in his first 15 charted seasons to two-thirds and nearly half the average in 2013 and 2014, respectively, and he shot nearly three times as many corner threes per 36 minutes as the average player this season. The leaders from the corners each season often take four to five times as many as the average player, though, sometimes even more when looking 10+ seasons back. James Jones led all players this year by taking 5.8x corner threes/36 minutes, but in 2005 Donyell Marshall took 7.1 times as many, then followed it up with 6.0x and 5.8x as many while Cleveland in 2006 and 2007, respectively. Fun times.

To touch on free throws, Allen’s charts almost always show him above the player average in free throw attempts/36 minutes during his prime which, like his attack off the dribble, feels underrated considering his status as a killer shooter.

I found his free throw and three point rates to be pretty interesting, even though they seem common in both his age and that when the free throws lower the threes often rise:

ft and 3p rates

I’ll touch more on threes later when chiming in on some thoughts on Allen’s scoring distribution, which I looked at in a similar way to shot attempts but with some tweaks. Below is a gallery visualizing four scoring stats from 1998 to 2014, but with some changes in charts from attempt distribution:

  • Points per game from the six spots on the floor.
  • Effective field goal percentage from all but free throws.
  • Point distribution but this time including free throws, unlike in the first gallery of graphs.
  • How Allen’s points/36 minutes from each spot measure up with the league average (per player).

Anyway, flip through the charts if you’d like:

This slideshow requires JavaScript.

There are some hopefully cool things to look at. Going back to mid-range shots, below is a similar graph like before but covering 2PM distribution:

2pm dist

And a gallery comparing 2PA and 2PM distribution. Flip flop if you’d like:

This slideshow requires JavaScript.

Season by season, Allen’s changes in point distribution from largest to smallest are a bit different from changes in FGA distribution, where the largest for that was from 2010 to 2011 and the smallest from 2004 to 2005:

ray point dist change overall

Understandably, the smallest change in point distribution was in Allen’s second season with the Heat. The largest change was not after a trade in 2003 or 2007 or going from the Celtics to the Heat in the summer of 2012, but from his seasons as a Buck in 2001 and 2002. 

Again, with simple subtraction, that all looks correct visually:

ray pt dist big and small

From 2001 to 2002, Allen scored less from the free throw line but upped his three point rate from .357 to .460. He took 3.67 times the average player’s corner 3s/36 minutes, ranking tenth minimum 1,000 minutes. For above the break threes (he attempted 3.32x the player average), he was only behind Antoine Walker (3.64), Jason Williams (3.70), and Tim Hardaway (4.22).

No shame in falling just behind those three players in anything related to threes, and Allen’s got pretty nuts when flipping through the 1998-2003 section of the scoring gallery shown above. Maybe suspected from the 2002 charts: Allen placed in the top 10 that season in both threes attempted and made for both the corner and above the break three. It started a string of top 10 finishes in the latter location:

ray 3pa-36 min leg avg

I thought Allen’s threes deserved a gallery of multiple charts, featuring both three-point attempt and made distribution from the five spots available on NBA.com’s shooting charts, another with accuracy from those locations, and a line chart tracking the shooting swings each season.

This slideshow requires JavaScript.

1998, 2002, and 2010 look almost perfectly balanced in attempt distribution from each spot, while some weirdly (for a right-handed shooter, anyway) show a great deal of threes from the right wing. Also, to go back to the graph of his shots with and without LeBron on the floor, it’s no surprise to see Allen taking more of his threes from the corner as a member of the Heat. Last year he teed off from the left side, but this year it’s from the right. Attempts from straight away are just about gone and weren’t ever a big deal anyway.

Below is a GIF of Allen’s combined distributions during his Buck, Sonic, Celtic, and current Heat career. The differences in attempted and made threes are pretty minor (click to enlarge):

A4ZqD7 on Make A Gif, Animated Gifs

Followed by that GIF are threes in 2003 before and after the trade that sent him from Milwaukee to Seattle. Quite a change midway through the season:

ray 3pa dist mil-sea 2003

Again, it’s kind of weird to see a right-handed shooter take a bunch of his attempts from the right wing, but Allen went through shifts from just about everywhere but from straight away. Shots from the corners and from straight on barely changed, at least in attempt distribution.

Lastly, Allen’s assist percentage on threes over the last two seasons are some of his highest ever. Among other notes, the right corner was a flat 100 percent for six straight seasons with 114 assisted threes during that stretch:

ray 3 ast%

Allen’s long been one of my favorites to watch from the times his NBA Live ’98 player torched me to how unfair he can make Miami’s offense just by standing in a corner. His charts were a test to see how they look in a blog post and if readers would be curious about ones for other players. A lot of other greats over the years have some cool charts, or maybe I’m biased because I was so curious about them to begin with. Probably the latter.

Some other thoughts:

  • I could’ve added playoff shooting and scoring, but was worried it would clutter this post even more.
  • Clutter…were there too many charts? A lot of them were player dependent, though. As much as I’d like to, I’d probably refrain from 3pt charts for someone like Tim Duncan. Maybe throw in a game of Solitaire instead.
  • The charts obviously don’t tell everything, like I can’t even put together SportVU-related shooting charts because the numbers don’t add up to Allen’s total points. I could try fooling around with them for other players, though, and see if something’s presentable.

Oh well. Curious what others think of this post and if any tweaks could’ve been made. This is definitely a trial version of posts I had in mind for other players and was also a post meant to shake off a ton of rust over the last few weeks.

%d bloggers like this: