Tag Archives: New York Knicks

East vs. West Week 14: The East is rolling, plus some splits

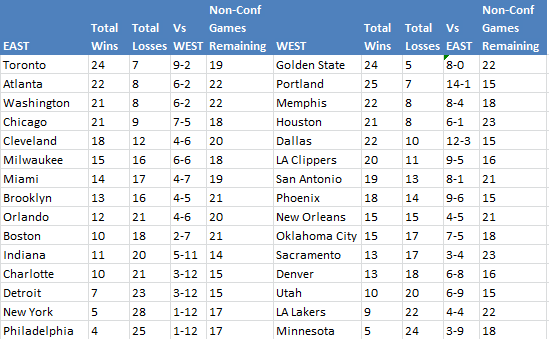
I thought I wouldn’t write any non-conference roundups until the all-star break, but check out Week 14. THE EAST. There were supposed to be 27 games, but two were postponed on Monday:

(Note: There were a couple errors in a master schedule I have in Excel. Correcting them led to some minor changes in this week’s table compared to others. Minor, but noticeable. Most notably, Week 3 changed from 12-7 to 11-8. Simple data entry mistake that I didn’t notice until now.)

Anyway, the East since Week 7 are 81-89 and last week went 14-11 last week against the West, arguably their best stretch of non-conference play this season. Some of that is a little misleading, though. Oklahoma City is clearly better than New York even though the Knicks gave the Thunder a loss that could be huge in the long run, and Phoenix was likely going to win against Chicago and Washington when both were on tail-ends of back-to-backs. I’m not saying the Suns are worse than those two teams, but rest matters and they had an advantage each game.

And I’ve been meaning to run some numbers that paint a better picture than just looking at overall wins and losses, real or Pythagorean, the latter statistic a little goofy when applied the way I’ve been using it in these posts. I mean, I like to think after 450 games there is a large enough sample size to determine just how good or bad each conference was, and it’s not like anything I do will answer all questions, but I played around with some East-West splits anyway.

So below is what I looked at. I find Oklahoma City inconsistent health-wise to the point I left them off all splits save for conference-wide ones. That sounds crazy but I separated the West into the top eight and bottom seven seeds, but the Thunder were so weird to me that I left them off both. Like, when healthy they’re a playoff team, so it’s not totally fair to put them in the bottom seven where I wanted to see how the best and worst of the East performs against the mehhhh section of the West. This all might sound ridiculous and I apologize. If I run similar splits at the end of the season I’ll include the Thunder. Or just remove the top 8 teams and see if anybody notices.

Cleveland was a close call also, but I included them. This is all controversial, probably. The power I have on my own blog is out of control sometimes:

dasidhasda

Surprise, surprise! Good teams beat up on bad ones! Specifically the West though. I think that proves how much more deep the conference is, though most of us already knew and love to complain about that. Sure, the top five in the East can hold up versus the best in the West with an emphasis on the Hawks, but the sixth to eight spots (and possibly ten by the end of the year) in the West are obviously stronger than the same East seeds.

It is nice that the East has a juggernaut in Atlanta, though, and maybe Cleveland in time, making the conference at least tolerable. I might’ve already said this in previous posts, but the second round in the East is going to be pretty damn fun.

Anyway, hope the splits were interesting. Below is a look at this week’s non-conference games:

week15

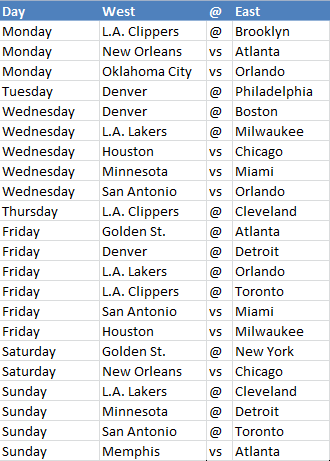
Three Nuggets and Lakers games for the East to feed off of as well as a 13-9 home-road advantage, and the East has some decent firepower overall. The top five teams play nine of the 22 games INCLUDING A GOLDEN STATE-ATLANTA MATCHUP. That’s probably the game of the week, but I’m writing this before I’ve done the Watchability Rankings so who knows.

Anyway, enjoy the week.

Advertisement

East vs. West Week 11: Detroit, Atlanta ruin big week for the West

A day late again because, well, I actually like posting on Tuesdays. I’ll be posting Watchability Rankings on Mondays at Nylon Calculus anyway, and it’s kind of cool to already have a small percentage of non-conference games played out before previewing the week.

So by win-loss and point differential, Week 11 was pretty average with the West going 13-10 with a margin of victory of +4.61. Below are the non-conference summaries:

Week 11 scores:

week11results

Should the color scales be reversed?

By point differential, the West ran over two wins worse than expected in Week 11 and nearly six wins worse over the last three weeks. Games against Cleveland, New York, Orlando, and Philadelphia are largely to blame. They aren’t the only East teams to lose against the West, but they’re getting squashed.

How about Detroit with Jodie Meeks and without Josh Smith, though? Seriously, what the hell? They beat two-thirds of the Texas Triangle last week, which may or may not have an impact on the final East vs. West record, and they spoiled a huge Week 11 for the West. They are running super hot to where they remind me of this insane hand in poker.

Also, the Atlanta Hawks are amazing. They snagged victories over the Clippers and Grizzlies which deserve more love than just two sentences. I am a terrible person for doing just that.

The Hawks don’t play a West foe in Week 12, though, and the Pistons only play one. So now I wonder how much of the non-conference records each year have to do with teams playing East vs. West games when they’re hot, cold, injured, very healthy, etc. I mean, I like to think it balances out over 450 games, but who knows? It seems like the East has more problems with those elements than out West, but I didn’t research that at all before writing it down, so…

Week 12’s schedule is below. Somehow only 18 games, yet the East has a 12-6 home-road advantage:

week12

Houston (two non-conference games this week), New Orleans (four), Memphis (two), and San Antonio (two) take road trips out East while Brooklyn and Orlando play host to a couple of them. Miami and Cleveland also play three non-conference games this week, though they’re all on the road. It’s a crucial point in the season for both teams for a variety of reasons. Atlanta, Chicago, Milwaukee, and New York are absent which, for the most part, that’s not great for the East. Out West, the Pacific Division holds all of the West’s home games. They hold all of the cards, heh, or something. Not really, it just sounds cool, maybe.

Welp.

Enjoy the rest of the week.

East vs. West Week 9: The East finally breaks through

After six weeks of embarrassment and two of mediocrity, the East finally had a breakthrough week in non-conference play, finishing Week 9 10-6. Time for the occasional celebration with a ham sandwich.

Toronto, Atlanta, and Chicago cleaned up for the East while New York, well, no. Just, no. For the West, the Clippers and Nuggets struggled in their multiple non-conference games while Portland took care of business against New York and Philadelphia. Not sure which team is better than the other, but kind of want to lean towards the Sixers.

Anyway, catch up on Week 9 and every other week if you’d like. Below is the week-by-week breakdown and the rest of the latest batch of non-conference scores.

week9

Experimenting with table formatting, if you didn’t notice already.

If you missed Week 8’s summary, I also compared this season’s non-conference numbers with the last 44 seasons. Turns out the West had a record-breaking win percentage, along with the third-best point differential. After Week 9, though, those numbers obviously took a hit and the win percentage is no longer the best mark ever.

It could get worse as the better teams of the East start playing more of the non-conference games. Below is a look at the amount of remaining matchups for every team in both conferences.

gamsasdasda

For the West, it’s somewhat balanced between how many of the East-West games have been played by the better or worse teams of their conference. Meanwhile, there’s been a problem in the East. Charlotte and Detroit are already halfway through their West schedule while Atlanta and Washington are only about a third of the way through theirs. The East has five niiiiice teams plus a feisty Milwaukee, but they’ve all played less games against the West than the bottom five in their respective conference.

Which brings us to Week 10. There are 22 non-conference matchups with Atlanta, Toronto, and Washington playing in 10 of them. The West will have a 16-6 home-road edge, though, as that’s one advantage the East had early on in the season, one that will vanish over this week and next.

Below is a look at the full schedule:

week10games

Enjoy the week. Curious how Week 10 ends up for the East. Things are starting to change in their favor, but I also need to dig a little deeper to confirm this, me thinks.


J.R. Smith’s shooting spree in charts

"<strong

J.R. Smith’s shooting chart over his last seven games.

While the Knicks’ season is veering off a cliff, J.R. Smith has come out with guns blazing in each of his last seven games, for better or for worse. He’s been one of the league’s leading scorers during that stretch at 23.7 per, much of it thanks to emptying the clip from beyond the arc by attempting 12.7 threes per game (!!!) and doubling his total attempts for the season in just two weeks. This was all capped yesterday afternoon when he set the record for attempted threes in a game with 22, a decent summary of the Knicks’ season and something only believable if it happened to, well, Smith himself.

But while some of those attempted threes have been cringe-worthy, Smith’s shooting over the last seven games has averaged out to decent efficiency: Nearly 24 points per game on about 18 shots and shooting splits of 48.5/46.3/100. Beyond the arc is where Smith’s done most of his damage, and by fooling around with similar charts I’ve used to visualize point distribution for teams we can see the shift in Smith’s scoring from his first 63 games to his last seven and even last three where he’s averaging 29.3 points. (If only that kind of scoring were sustainable, for NBA Twitter’s sake.)

The first chart we’ll look at is point per location from the normal six areas of the floor: restricted area, in the paint (non-restricted area), mid-range, corner three, above the break three, and free throws. As an example, below is Smith’s point distribution per game through his first 63 outings:

jr smith ppl england

Smith’s scoring weighed heavily toward the above the break three, for better or for worse, with nearly six points (5.62 to be exact) coming from that area of the floor. No other area gets as many as three points, with mid-range being the second most frequent scoring area at 2.86 points per.

Now, below features the graph previously mentioned along with his scoring distribution per game over his last seven outings and last three:

Smiff PPL

Click to enlarge. Quite helpful!

The very first chart provided shrinks considerably thanks to the max values provided to fit in Smith’s recent, unreal three-point barrage, and for the most part that’s all where he’s scored from. About three-fifths of his points coming from that scoring zone over his last seven games and two-thirds over his last three. The corner three and mid-range areas get some attention as well, but anywhere inside the paint and at the stripe has been mostly neglected.

Lastly, here’s a GIF of the increase:

smiff ppl on Make A Gif

While Smith’s upped his three-point attempts, the uptick in usage from 20.8 in his first 63 games to 25.9 over his last seven hasn’t hurt his overall efficiency. In fact, during the recent stretch, Smith’s effective field goal percentage is 62.2 compared to a pedestrian 48.6 during his first 63 games.

Below hopefully shows that increase from five spots on the floor, minus free throw shooting. A reminder should be given that Smith’s shots recently have largely come from the perimeter. He’s only taken a combined two shots per game from the two areas inside the paint.

Click to enlarge.

Click to enlarge.

And like with points per location, below is a GIF of the increase in EFG% across the three stretches of games:

smiff EFG% on Make A Gif

Surely this isn’t sustainable, though there’s only four games left for the Knicks so we might see Smith lock and load until season’s end. New York doesn’t play another game until Friday anyway, giving him plenty of time to rest his shooting hand.

Edit: Previously, I mentioned that Smith holds the record for games with 10+ 3PA with four, but according to Basketball-Reference there’s actually a tie between multiple players for seven straight games of 10+ attempts. There’s still time for Smith to join that group as his streak is still alive, but for now he has a few games to go.

All stats are according to NBA.com.

East vs West Week 21: Two records still alive for West

The non-conference update follows games pitting the Western Conference’s teams versus the East’s. This season, the West has often held a winning percentage so large it hasn’t been seen in over 50 years.

One week after going under .500 in non-conference play, the Western Conference dominated the East in the 21st week of the season, finishing 21-6. Miami and Indiana finished a combined 1-2 but Brooklyn, 16-11 against the West, has become a third team out East to perform well in non-conference games. The first round of East matchups might be a dud, but the second round should be terrific.

Out West, the Lakers have become the worst team in non-conference play at 11-17, one game behind Utah. Overall, they have the same record with both having won their last game. Boston has leapfrogged them both for fourth place in the lottery.

Anyway, below is an updated week-by-week breakdown of non-conference wins and losses:

The West’s best results since week 5, 7 and 19, keeps two records in reach:

The West’s record-high in non-conference winning percentage, set at 63.3 percent in 2004

I mention this one in pretty much every post, but it was in doubt even after starting the first half of the season by winning two-thirds of their games against the East. The West will have to finish at least 19-11 over the last four weeks. Each conference has 15 of those games at home.

Every playoff team out West recording 20 non-conference wins

Mentioned in my last non-conference post. Every team in the top eight but Memphis has already hit that 20-win mark. The Grizzlies, 19-9 versus the East, have one game left against Miami but also face Philadelphia. The real risk comes from Phoenix, now 17-10 with the Hawks, Wizards, and Knicks on their schedule this week. The Suns are currently on a three-game winning streak, so maybe they’ll build on it and find their way back into the top eight in the West.

Aaaand as improved as the East has been over the past couple months, games against them are still looked at as a way to build winning streaks. I can’t help it, and maybe it will never change. Regardless, this is the last major week for non-conference play, and unless the two previously records for the West are broken over the next seven days I probably won’t update this until the end of the season.

Let’s see how this week plays out, though, especially for Phoenix. Their playoff hopes depend on how they perform against the East this week. Worth looking at out East would be the Knicks and Hawks, with the former going on a road trip to the West coast all while continuing a ridiculously soft schedule as of late while the latter plays Phoenix, Minnesota, and Portland this week.

%d bloggers like this: