Quite a few teams have jumped out to unexpectedly hot starts before the Christmas games, arguably the most surprising being the Portland Trail Blazers. They have tall tasks coming up against the Clippers, Heat and Thunder, but for now they’re 23-5 and first in the West, just barely ahead of Oklahoma City and San Antonio.
For Portland to get to 20 wins before Christmas is quite an accomplishment and a sign of success across the entire regular season. From 2000 to 2013, 30 teams out West have reached 20 wins before December 25, which averages out to about 2.3 teams per season. 2014 surpassed that mark with four total.
Below is a table showing each team in the West’s 20-win club over the last 14 years:
20 wins before Christmas
Season
Team
W-L by 12/25
82-game record
West rank
Finish
1999-00
Los Angeles Lakers
22-5
67-15
1
Won Finals
Portland Trail Blazers
20-7
59-23
3
Lost Conf. Finals
2000-01
Utah Jazz
20-8
53-29
4
Lost First Round
Los Angeles Lakers
20-10
56-26
2
Won Finals
2001-02
San Antonio Spurs
20-5
58-24
2
Lost Conf. Semifinals
Sacramento Kings
20-9
61-21
1
Lost Conf. Finals
2002-03
Dallas Mavericks
23-4
60-22
3
Lost Conf. Finals
Sacramento Kings
22-8
59-23
2
Lost Conf. Semifinals
2003-04
Los Angeles Lakers
20-6
56-26
2
Lost Finals
Sacramento Kings
20-6
55-27
4
Lost Conf. Semifinals
San Antonio Spurs
20-10
57-25
3
Lost Conf. Semifinals
2004-05
Phoenix Suns
23-3
62-20
1
Lost Conf. Finals
San Antonio Spurs
21-6
59-23
2
Won Finals
2005-06
San Antonio Spurs
21-6
63-19
1
Lost Conf. Semifinals
Dallas Mavericks
20-7
60-22
4
Lost Finals
2006-07
San Antonio Spurs
21-7
58-24
3
Won Finals
Dallas Mavericks
20-7
67-15
1
Lost First Round
Utah Jazz
20-8
51-31
4
Lost Conf. Semifinals
2007-08
2008-09
Los Angeles Lakers
23-5
65-17
1
Won Finals
2009-10
Los Angeles Lakers
23-4
57-25
1
Won Finals
Dallas Mavericks
20-9
55-27
2
Lost First Round
Denver Nuggets
20-9
53-29
4
Lost First Round
2010-11
San Antonio Spurs
25-4
61-21
1
Lost First Round
Dallas Mavericks
23-5
57-25
3
Won Finals
Utah Jazz
21-9
39-43
11
Missed Playoffs
Los Angeles Lakers
21-8
57-25
2
Lost Conf. Semifinals
Oklahoma City Thunder
20-10
55-27
4
Lost Conf. Finals
2011-12
2012-13
Oklahoma City Thunder
21-5
60-22
1
Lost Conf. Semifinals
Los Angeles Clippers
21-6
56-26
4
Lost First Round
San Antonio Spurs
21-8
58-24
2
Lost Finals
2013-14
Portland Trail Blazers
23-5
Oklahoma City Thunder
22-5
San Antonio Spurs
22-6
Los Angeles Clippers
20-9
34 teams
57.8-24.2
So average regular season records those teams finish with are often quite good. Only one team finished with less than 50 wins and the average 82-game record is just under 58-24. It wouldn’t be all that surprising to see all four teams this year finish with 58 wins before the playoffs, fattening up in non-conference matchups in the process. No team with over nine losses by Christmas, however, has won over 58 or more games since Chris Webber and the 2002 Kings. The Clippers are probably out of luck, at least until they get J.J. Redick back.
Only one team missed the playoffs on that list: The Utah Jazz of 2011 who had a mess of a season. They’d lost Carlos Boozer the summer prior and replaced him with Al Jefferson, who is now in Charlotte. Utah now has Richard Jefferson and his expiring contract. Will Utah replace him next summer by drafting another Jefferson? The Jazz also ended the season without Jerry Sloan and Deron Williams while prolonging a total rebuild. None of the four 20-win teams this year match what Utah went through. Portland did have an active off-season, but to match Utah’s they’d have to ship LaMarcus Aldridge for, say, David Lee, then have Damian Lillard request a trade down the road. Hmm…
Some other notables from the 20-wins-before-Christmas Club:
Of the 29 20-wins-before-Christmas teams that made the playoffs, six lost in the first round.
15 teams made at least the Conference Finals. It’s basically a lock that one of the four this year makes it unless we have a Houston-Golden State matchup. Not likely, but nonetheless possible.
10 of the 13 seasons have featured a 20-wins-before-Christmas team represent the West in the NBA Finals.
Portland, Oklahoma City, San Antonio, and the Los Angeles Clippers are in a club that often entails success down the road, but a few stumbled despite a hot start. Let’s see which starts were more on the fluky side and ones that were the real deal.
Until then, happy holidays. I need to wrap my presents. Where’s the duct tape?
We all know the Eastern Conference has been weaker this season than it usually is. Every night, a few games out in the west coast will make us excited about a future playoff matchup like last night’s back-and-forth between the Clippers and Timberwolves. Meanwhile, it seems like the Bobcats and the Bucks are playing against each other every night out east. Please, let Indiana and Miami be at full strength come May!
It doesn’t help when the matchups in non-conference play have been historically lopsided this season, though last week finally provided some relief for the East. It was the first time since November 4 to November 10 that they went over .500 against the West. Here’s a week by week breakdown:
Week
Weekly West wins-East wins
West-East wins through listed week
Winning % through listed week
October 29 to November 3
7-2
7-2
77.8%
November 4 to November 10
7-8
14-10
58.3%
November 11 to November 17
17-6
31-16
66.0%
November 18 to November 24
13-1
44-17
72.1%
November 25 to December 1
13-6
57-23
71.3%
December 2 to December 8
10-8
67-31
67.0%
December 9 to December 15
16-2
83-33
71.6
December 16 to December 22
8-10
91-43
67.9
As you can see, the West started laying the smackdown on Week 3. That’s pretty much when the jokes about the East started to surface. It only got worse as the West went 26-7 over the following two weeks against its “toothless Eastern cousin”, as netw3rk dubbed them. Last night, they needed Toronto to beat Kevin Durant and Oklahoma City AT OKLAHOMA CITY, WHERE THE THUNDER WERE UNDEFEATED, just to finish over .500 against the West. Somehow, Toronto came through.
Depending on what you characterize as “crunch time”, though, the sample sizes can be even smaller than the ones I included for this post. For example, if it means when there’s one minute left in a close game then some teams will have only totaled 10 to 15 minutes. There would also be a ton of free throws and last-second situations, which makes for inflated offensive ratings and pace.
FUN FACT: Only the Raptors have a pace below 100 with one minute left in crunch time, according to NBA.com, which makes sense when Dwane Casey has a knack for wasting 2-for-1 opportunities and/or not fouling when down with 25 seconds left:
Every other team has a pace ranging from 116 to 156. If we define crunch time as within five minutes left and either up or down by five points (like what I used to determine the go-to players), the pace goes down to anywhere between 90 and 105. We also get a larger sample size between 30 and 80 minutes, depending on the team.
Let’s see how this works out, beginning with the best and worst 10 teams according to net rating and then by shooting percentages.
Net Rating
The top 10
Team
MIN
W
L
OffRtg
DefRtg
NetRtg
+/-
PACE
Memphis Grizzlies
37
7
4
125.2
83.8
41.4
29
88.98
Portland Trail Blazers
51
12
2
133.9
95.5
38.4
49
101.28
Indiana Pacers
40
9
2
117.5
94.7
22.8
24
95.91
Philadelphia 76ers
64
6
7
115.1
94.2
20.9
10
105.18
Oklahoma City Thunder
48
10
3
115.9
98.8
17.1
18
104.18
Dallas Mavericks
47
9
7
105.7
90.9
14.8
26
92.86
Denver Nuggets
39
8
4
108.6
95
13.6
15
104.43
Phoenix Suns
49
10
6
112.5
99.2
13.3
15
95.24
Utah Jazz
46
5
6
123.4
112.3
11.1
15
94.64
New Orleans Pelicans
64
6
6
117
106
10.9
-4
95.89
It’s weird to see a positive net rating for the Pelicans when their plus-minus is negative four. I’m not exactly sure how that happened or how it happens in the first place.
The Marc Gasol-less Grizzlies are at the top, though. They’re the best defensive rebounding team in the league in crunch time, grabbing 85.3 percent of opponent’s misses and allowing only four second-chance points. Memphis also grinds the game to a halt, relinquishing only two fast break points and 22 points in the paint. The former stat ties with Miami for best in the league while the latter ties for second with Indiana and San Antonio. (Dallas is best at preventing points in the paint during crunch time by allowing only 20 over 46 minutes of play. Utah is near the top of that list, as well as in least fast break points allowed.)
Memphis seems misleading offensively, however. 35 of their 87 points come at the line, they’re horrible from the arc and they don’t get second chance or fast break points. Their offensive efficiency should drop in time and their defensive efficiency should take a hit without Gasol, though Tony Allen remains as a key defensive cog.
For the Blazers, they squeak into the top 10 in fast break and second chance points but blow teams away from the arc, shooting 18 for 39 on threes. It also helps when Damian Lillarddoes Damian Lillard things:
The Jazz are also up there in scoring efficiency, mostly thanks to shooting nine for 16 from three and a good dose of (gasp) Marvin Williams. Meanwhile, Oklahoma City has actually been terrible from the field, shooting just 15 for 60 on shots outside of the restricted area. It’s like them and the Jazz got their stats mixed up.
More on shooting percentages in a bit. Let’s look at the 10 worst teams in crunch time, according to their net rating:
The bottom 10
Team
MIN
W
L
OffRtg
DefRtg
NetRtg
+/-
PACE
Brooklyn Nets
41
4
8
80.1
106
-25.9
-32
102.7
Chicago Bulls
70
4
9
91
115.2
-24.3
-26
94.14
Golden State Warriors
59
5
7
88.4
112.4
-24
-24
95.38
Sacramento Kings
52
3
8
88.4
105.7
-17.3
-22
91
Orlando Magic
55
5
10
93.2
109.4
-16.1
-21
101.24
Atlanta Hawks
48
7
8
94.8
109.6
-14.9
-19
91.05
Milwaukee Bucks
62
4
9
96.9
109.8
-12.9
-19
101.23
New York Knicks
54
4
10
87.4
100.3
-12.9
-18
93.97
Charlotte Bobcats
41
6
8
91.5
104
-12.5
-15
100.9
Cleveland Cavaliers
54
7
7
92.7
103.3
-10.6
-9
92.51
It’s interesting that Toronto’s not up there until realizingRudy Gay was pretty good in late-game situations.
Quite a few of these teams are at or near the bottom 10 in allowing fast break and second chance points. They also give up a few more free throws. 22 of Golden State’s 54 free throws allowed, for example, have come within one minute left. The discrepancy of fouls drawn is huge within one minute as well, with Golden State only drawing two compared to being whistled for 14.
It’s odd that Golden State has one of the worst net ratings since Stephen Curry has been one of the best in crunch time, but the foul discrepancy over the final five minutes of close games is pretty consistent with the best and worst teams. Four of the top five with the largest foul differential not in their favor are also in the bottom 10 teams in regards to net efficiency. Meanwhile, four of the top five with fouling in their favor are in the top 10.
Large positive and negative net ratings are typical over the course of a season, but the small sample sizes allow for change over the next four months. Shooting percentages can also change. Let’s take a look at the 10 best and 10 worst shooting teams in the crunch, sorting them by effective field goal percentage.
Shooting Efficiency
The top 10
Team
MIN
eFG%
NetRtg
AST%
Field Goals
FG%
3FG
3FG%
FT
FT%
Portland Trail Blazers
51
0.581
38.4
0.512
41-86
47.7
18-39
46.2
48-58
82.8
Phoenix Suns
49
0.564
13.3
0.442
43-86
50.0
11-28
39.3
21-27
77.8
Philadelphia 76ers
64
0.562
20.9
0.560
50-97
51.5
9-22
40.9
42-55
76.4
Utah Jazz
46
0.549
11.1
0.514
35-72
48.6
9-16
56.3
35-44
79.5
Denver Nuggets
39
0.534
13.6
0.630
27-59
45.8
9-23
39.1
31-49
63.3
Miami Heat
35
0.519
8.6
0.696
23-52
44.2
8-20
40.0
24-32
75.0
San Antonio Spurs
30
0.508
-6.0
0.586
29-61
47.5
4-14
28.6
11-18
61.1
Dallas Mavericks
47
0.507
14.8
0.529
34-73
46.6
6-17
35.3
28-33
84.8
Memphis Grizzlies
37
0.500
41.4
0.542
24-52
46.2
4-14
28.6
35-42
83.3
Los Angeles Clippers
48
0.494
7.9
0.429
35-80
43.8
9-23
39.1
42-56
75.0
Weird note: Dallas and Phoenix already have 16 games that qualified for crunch time numbers, the most in the league. San Antonio has had the least games by far, with only 8.
I was expecting a lot of the Suns’ threes coming from drive-and-kick situations thanks to Eric Bledsoe and Goran Dragic, but most came from shots off the dribble. Gerald Green had one contested fast break three that displayed terrible judgment, but went in anyway. Whatever.
Not surprisingly, though, the best effective field goal percentages come from the teams draining threes. There are also teams you would expect to be at the top: Miami, San Antonio, Dallas, the Clippers, and probably Portland. “Star-less” teams like the Jazz and Nuggets are also shooting better than the Knicks, for example. More on New York in a bit.
There’s also a pretty big difference in assist percentage between the best and worst, among other stats. It’s no surprise that Toronto, Cleveland, Detroit, and Charlotte are at the bottom of that statistic when each often rely on their point guard or a wing to go one-on-five. And just like that, I spoiled nearly half of the bottom 10 teams:
The bottom 10
Team
MIN
eFG%
NetRtg
AST%
FGM
FG%
3FGM
3FG%
FT
FT%
Charlotte Bobcats
41
0.340
-24.3
0.348
23-72
31.9
3-18
16.7
27-33
81.8
New York Knicks
54
0.346
-10.6
0.607
28-91
30.8
7-36
19.4
31-35
88.6
Chicago Bulls
71
0.365
-17.3
0.579
38-115
33.0
8-30
26.7
33-44
75.0
Milwaukee Bucks
63
0.368
-12.9
0.516
31-95
32.6
8-23
34.8
36-46
78.3
Toronto Raptors
44
0.372
-2.5
0.346
26-78
33.3
6-20
30.0
22-35
62.9
Cleveland Cavaliers
54
0.390
-12.5
0.333
36-100
36.0
6-26
23.1
29-43
67.4
Detroit Pistons
51
0.392
-24.0
0.313
32-88
36.4
5-18
27.8
28-38
73.7
Brooklyn Nets
42
0.397
-25.9
0.440
25-68
36.8
4-19
21.1
14-27
51.9
Indiana Pacers
40
0.400
22.8
0.520
25-70
35.7
6-22
27.3
41-49
83.7
Golden State Warriors
60
0.410
-14.9
0.472
36-100
36.0
10-34
29.4
22-29
75.9
A few of these teams were expected to struggle. The Bulls and Nets have been depleted, Milwaukee’s a mess, and the Pacers – wait, what? Like last year, Indiana barely squeezes into the bottom 10 in shooting efficiency. Their free throws help put them in the middle of the league in true shooting, however. Overall, their offensive efficiency is about average.
At the bottom in effective field goal percentage are the Bobcats. Charlotte can’t seem to make anything outside the restricted area, but they have nothing on Carmelo Anthony, J.R. Smith and the rest of the Knicks. If we fiddle around with the minutes that represent crunch time, we get this out of New York:
More Knicks stats in crunch time
Time
MIN
OffRtg
DefRtg
NetRtg
FG
FG%
3FG
3FG%
FT
FT%
Last 2 minutes
21
83.6
83.3
0.40
8-42
19.0
0-18
0.0
22-26
84.6
Last 1 minute
11
71.3
90
-18.6
4-25
16.0
0-14
0.0
12 16
75.0
Those field goal percentages are dead last in the league. Only two of the made field goals within two minutes have come outside the paint (two-for-25). That should change for the better with Tyson Chandlerreturning as soon as tonight. It can’t get much worse, though I’ve come to expect the unexpected from New York.
Overall, the sample sizes are admittedly small but nonetheless worth looking at. There’s plenty of time for teams to turn things around but an awkward outlier or two will probably remain, like when the Charlotte Bobcats and the post-LeBron James pre-Kyrie Irving Cleveland Cavaliershad two of the best net ratings in crunch time in 2011. Miami will likely creep their way into the top 10 in terms of net rating as well. They’re just too suffocating to be left out.
About a month before the season, LVH SuperBook at Las Vegas released their 2013-14 NBA Division odds as well as over/under win totals for each team.
While the win totals provide for plenty of discussion five weeks into the season, betting the correct side of the over/unders yields only so much of a return on the initial investment (unless you can do a parlay). Going far against the odds when picking division winners, however, could mean loads of winnings if everything comes to place. Let’s take a look at the one division where that could most likely happen: the Atlantic.
Once again, odds are according to LVH SuperBook:
Brooklyn Nets: 4-7
New York Knicks: 3-2
Toronto Raptors: 10-1
Boston Celtics: 60-1
Philadelphia 76ers: 500-1
Boston currently holds a three-game lead over Brooklyn and New York. That’s nothing at this point, especially when Boston’s goals this season are likely different from the two favorites coming into the season, but it makes you wonder if anyone put a wager on the Celtics’ hopes in the Atlantic as a joke (ahem, Bill Simmons?) then recently started following it closer than expected because you never know.
Currently, John Hollinger’s odds of the Celtics winning the Atlantic are 62.4 percent, something I don’t agree with since it doesn’t seem to take into account recent transactions and how much of an impact the 2014 Draft has on certain teams. Toronto, for instance, has a 63.2 percent chance of making the playoffs (26.5 percent to win the division).
I’ll bet against that when they just traded Rudy Gay, which is addition by subtraction but still; Toronto will make another move soon. Kyle Lowry seems to be the latest Raptor on the block, but we could see more players shipped in the near future. The same could be said for Boston, but probably not until they get a feel for what the team is like with Rajon Rondo.
The odds are sure to change after this week. Boston plays at Brooklyn tonight and hosts New York on Friday, the latter in an eight-game stretch where seven are at home. We might even see Boston on top of the Atlantic for the rest of December, one of the bigger surprises this season probably to both fans and those who bet in their favor.
Also, if you were wondering, Portland was 10-1 to win the Northwest.
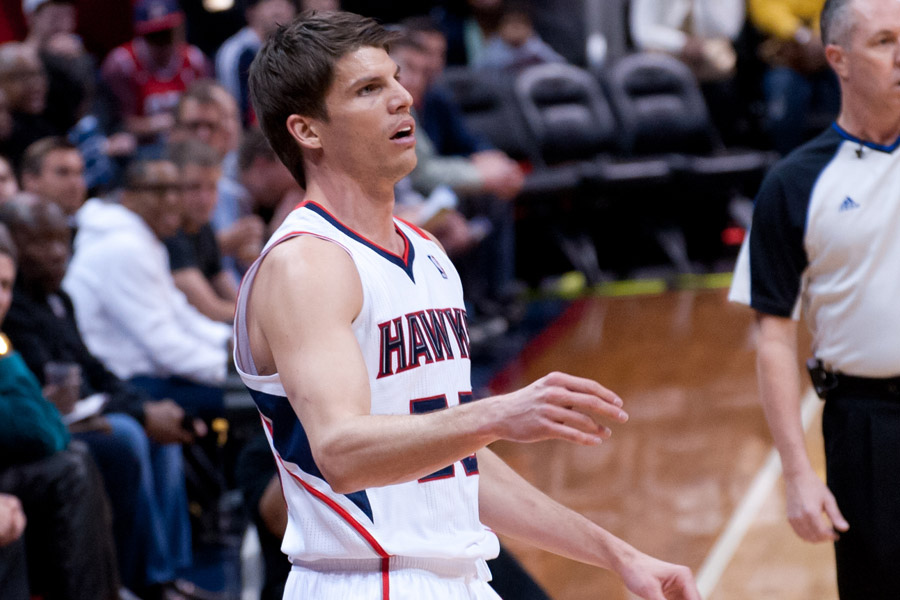
Kyle Korver has been terrific out of the gates, making nearly 52 percent of his threes on over five attempts per game. Fantasy basketball-wise, the Hawks’ starting small forward (or shooting guard, depending on the night) is ranked in the top 50 for both eight and nine-category leagues, according to Basketball Monster.
Korver went off last night against the Clippers, shooting 6-for-9 on threes to help the Eastern Conference nab a rare win over a team out West, but just how many players have made six or more threes in a game this season? I took a look, via Basketball-Reference. At first, I wanted to list every time an active player made six threes in their career, but that totaled to about 800. That, and Basketball-Reference uses the term “active” a little loosely since Tracy McGrady, among others, is still listed as that.
Anyway, take a look at this year’s six threes club. I also included minutes, home/away games, win-loss results, and some others just to look at the differences between each player listed:
Unsurprisingly, a team with a player who’s made six threes has won just under two-thirds of those games. More interesting is how often those threes were made on the road. You’d expect some role players off the bench who are listed here to perform better at home. Maybe they do and the three-point outburst is just an outlier. We’ll see if that’s true as the season progresses.
Also worth noting, 8.5 percent of total games by those players have involved making over six threes. Should that frequency remain the same, someone on that list will make six threes on Friday night at the latest. Let’s see who that is, or if another player will join the club exclusive to only…25 players. That’s kind of a big club through just five weeks and it’s obvious what the password is to get in, but whatever. It’s great to witness three-point barrages and there’s still four months left for them to happen.