Tag Archives: Rasheed Wallace

New Page: My Soup

nw
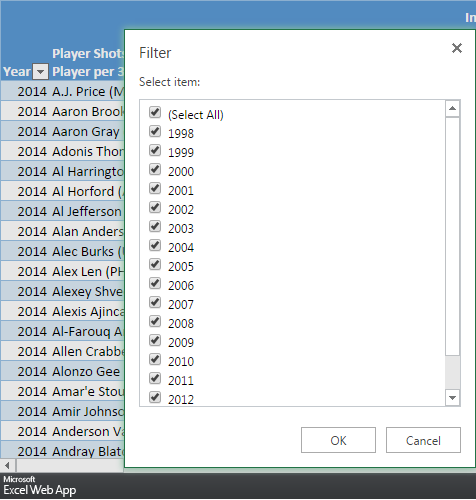
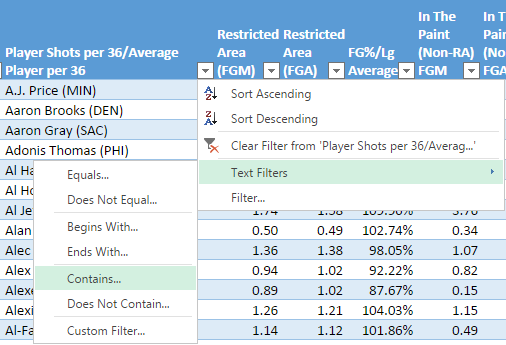
I created some wonky stats over the off-season. Sometimes they were included in tweets with little success, but I dug myself a deeper hole by featuring some in blog posts and now a new page that lists those statistics. It starts with Shots Per 36 Compared to Average Player. You can find that with regular per-36 stats since 1998 here, via NBA.com.

This basically divides a player’s average field goal attempts per-36 from a certain zone by the average amount a player averaged that season. For example, a player who averaged 4.6 shots per 36 minutes in the restricted area in 2014 took 1.15x the average attempts per 36 for a player that season. The player in that example was Josh Smith:

josh smith

In the screenshot, you can see Josh Smith also had above-average accuracy around the rim last year. I also included that for every shot zone: Restricted area, in the paint (non-RA), mid-range, corner 3, above the break 3, and free throws.

I like to think this stat is helpful, but it has its limitations. With possession totals either estimated or newly released in their exact numbers, per-36 minutes stats are outdated but this is all I had to work with over the summer. Some players’ numbers will be a tenth of a point larger or smaller because of the pace of their team(s), but I feel fine in saying that these numbers are close enough to be taken seriously.

So how to best sort through tables? They are pretty huge since they list all players as far back as 1998 and Excel’s web app has its limitations. I’d suggest using filters to find what you’re looking for more efficiently.

Here are some examples.

You can narrow down each column by clicking the drop-downs and select either ‘Number Filters’ or ‘Filter…’:

filter1

For seasons, going with ‘Filter…’ is easier. Here’s what that looks like:

filter2

You can simply check and uncheck what seasons you want. ‘Number Filters’ is more useful for shot statistics:

filter top 10

If you want to find a specific, you can go to that drop-down and go to ‘Text Filters’. I’ll look for Rasheed Wallace:

name filter 2

namefilter 4 name filter 3

But if you want to group players together, go to ‘Filter…’, though it might help to narrow down the seasons too. There are also filters for total minutes and NBA.com’s usage rates.

namefilter

Again, you can find these stats and tables of Shots Per 36 Compared to Average Player here. Over the season, I might add on to this but there’s also a good chance more stats will be found at Nylon Calculus.

Advertisement

Sums and differences of rookie-scaled contracts since 1995

Thanks to a mistake I made in Excel, I recently updated a post from over two months ago about how much money a first-round prospect could lose in the 2014 Draft if they were drafted at a worse slot than they’re slated to go, or how much extra cash they could make if they rose.

I’m actually going to post that here as well, but along with the sum and differences of every rookie-scaled contract of first-rounders since 1995, back when Joe Smith, Kevin Garnett and Rasheed Wallace, among others, were selected. You can find yearly rookie-scaled salary at RealGM from 1995 to 2020 (a really cool page in my opinion), and the earnings from first-round draftees are consistent with what shows up in the Salaries section of Basketball-Reference’s player pages. The key thing is to multiply the salary on RealGM by 1.2, as most players get that 20 percent bump allowed in their rookie salary.

The first tables I made were for the total amount of salary each draft pick could make. These, along with every other table in this post, assume every first round pick got the 20 percent raise and played every year of their rookie contract. I also attached extra sheets about what percentage a non-first overall pick makes compared to the top draftee and the increase in salary each year from first round picks. The lockout-shortened seasons mark the biggest increases/decreases from year to year, among other noticeable things.

Take a look if you’d like. Each season is the first year of a rookie contract, so Garnett’s would be 1996, Kobe Bryant‘s 1997, Anthony Bennett‘s 2014, and so on. Below that are differences in cash from each draft slot:

Below are differences in three and four-year rookie contracts. At first I listed players with their draft slot for easy comparing, but it made tables too messy. Basketball-Reference’s draft pages might help.

Again, each season marks the first year of a rookie contract so Garnett’s would be ’96, Bryant’s as ’97, Bennett’s as 2014, and so on. Easy to mistake that when looking at sheets in the middle.

Hopefully that helps those who are posting re-drafts, something I’m seeing a lot of lately. Crab Dribbles is currently in the middle of their series from 2003 to 2013 while Amin Elhassan and David Thorpe of ESPN looked at some draft classes too (Insider-only). There’s also been some good, fun Twitter discussion about where Kawhi Leonard would land in a 2011 re-draft. Just how much would he make if he went from 15th overall to, say, second? What about others who would get a nice bump in pay?

We can look at that and a few other players who may come to mind. I had a lot of fun reading re-drafts so I actually made some of my own to look at the biggest raises from each rookie class. I’m sure a few re-picks are debatable as they’re not team-specific to begin with. I also left off initial second-rounders, but it goes to show what an uptick in the sum of rookie contracts can be like. Players with the largest increase in pay from each class are sorted by their rookie years, and I included some notes about picks I wasn’t sure of or thought were more interesting than others:

The largest increases happen when players went to the very top versus late-1sts going into the late-lotto, etc. Some players like Michael Carter-Williams (and possibly ones from draft classes down the road) would’ve had raises in their rookie contracts as large as the first year of a mini-max contract. I also think actual draft slots have an impact on second contracts, which is another post but it can be tested by what Evan Turner makes next season.

Anyway, hope this was interesting. For those continuing to do re-drafts and/or looking at this year’s prospects, hope this helps and adds a little more to discussions. Keep up the good work.

As a reminder, salaries are according to RealGM.

LaMarcus Aldridge’s rebounding compared to Rasheed Wallace’s

Tiago Hammil | Flickr

Tiago Hammil | Flickr

Over the last decade or so, a few of the NBA’s premier forwards have been with the Portland Trail Blazers. Rasheed Wallace was traded when Zach Randolph‘s career was just getting started, then Randolph was traded just when LaMarcus Aldridge became (and remains) a building block for Portland. Of the three forwards, Aldridge is the only one who’s kept his head on straight through the first half of his career. Let’s hope that doesn’t change.

And last night against Houston, Aldridge became the only one of the three to accomplish the statistical feat of 30+ points and 25 rebounds as a Blazer. No player in the franchise’s history had accomplished that. One particular offensive rebound — leading to a bucket and a foul — triggered memories of Wallace a decade ago. Where was this when ‘Sheed was in his prime? He’s one of my favorite players ever, but I can’t get past him never averaging 20 points and 10 rebounds (let alone nine) for a single year. More on his rebounding in a bit.

Aldridge has been on an absolute tear recently, averaging 13 rebounds in his last 10 games along with 25.9 points, 2.9 assists, just 1.3 turnovers, and 1.5 fouls. The rebounding numbers are a little misleading since Aldridge is the only rebounder in the top 25 to grab less than 30 percent of contested boards, according to SportVU, but it’s nonetheless impressive.

We know now that Wallace never became elite on the glass, but Aldridge had only been an average rebounder going into this season, similar to ‘Sheed at the same stage of his career. Because of that, I wanted to look at the two forwards who came to Portland ten years apart and their rebounding, specifically between the ages of 25 to 28 when both came into their own as players. 

We’ll start with their rebounding stats per-36 minutes:

Player Season ORB DRB TRB PTS
Rasheed Wallace 2000-03 1.7 5.8 7.4 17.8
LaMarcus Aldridge 2011-14 2.7 5.7 8.4 20.6

Adding field goal attempts, free throws, etc. was tempting, but those stats don’t necessarily make rebounding much worse if at all. (You’ll see in the next graph that ‘Sheed’s rebounding actually improved when he started taking threes.) From the per-36 numbers, though, neither player’s rebounding stats are all that impressive. Wallace’s look quite terrible.

We can see if those numbers by either player deceive or confirm how they look in a table showing the percentage of rebounds they grab while on the court:

Player  Season Age G PER 3PAr ORB% DRB% TRB% USG%
Rasheed Wallace 1999-00 25 81 18.1 0.048 5.6% 17.2% 11.7% 21.9%
Rasheed Wallace 2000-01 26 77 20.9 0.138 6.2% 17.9% 12.2% 23.4%
Rasheed Wallace 2001-02 27 79 19.3 0.246 5.3% 20.4% 12.8% 23.7%
Rasheed Wallace 2002-03 28 74 18.5 0.281 5.1% 19.6% 12.3% 23.3%
Total 2000-03   311 19.2 0.182 5.6% 18.8% 12.3% 23.1%
LaMarcus Aldridge
2010-11 25 81 21.5 0.016 10.1% 17.2% 13.5% 25.7%
LaMarcus Aldridge
2011-12 26 55 22.7 0.012 8.6% 17.5% 12.9% 27.0%
LaMarcus Aldridge 2012-13 27 74 20.4 0.011 7.2% 20.9% 14.0% 26.5%
LaMarcus Aldridge 2013-14 28 23 23.8 0.004 6.7% 24.7% 15.8 28.7%
Total 2011-14   233 21.6 0.012 8.5% 19.1% 13.7% 26.5%

Worth noting: Last night, Aldridge nearly doubled his percentages coming into the game, getting 12.2 percent of available offensive rebounds, 45 percent of defensive ones, and 29.2 percent total.

Neither player’s total rebounding percentage over a four-year span lights up the league, though. Among the 290 forwards and centers from 2011 to 2014 (minimum 40 games played), Aldridge is ranked 119th. As for Wallace, from 2000 to 2003 (minimum 50 games), he was 163rd out of 279. Aldridge sits between the top-third and top-half of the league, Wallace lies between the bottom-half and bottom-third with a percentage less than Eddy Curry‘s, post-surgery Tom Gugliotta‘s, Keith Van Horn‘s, and Dirk Nowitzki‘s, among other players not known for their rebounding either.

What separates Aldridge from Wallace a decade ago is the offensive glass, even if Aldridge’s seems to be declining each season. Like mentioned earlier, Wallace’s rebounding percentages increased when he started taking threes, but the offensive rebounding dipped slightly. He was 226th out of 279 forwards and centers in offensive rebounding percentage while Aldridge is currently 125th out of 290, a clear difference between terrible and average.

Rasheed  Wallace in Detroit. (Keith Allison via Flickr)

Rasheed Wallace as a Piston in 2008. (Keith Allison via Flickr)

Personnel also affects rebounding totals. There’s just not as many rebounds available when playing alongside Marcus Camby and Gerald Wallace, which Aldridge occasionally did during 2011 and 2012. His rebounding improved when playing alongside J.J. Hickson and Nicholas Batum, the former replaced by Robin Lopez this season. 

It’s a similar case for Wallace, who played with Brian Grant (traded after ’00) and Arvydas Sabonis in through ’01 before improving in defensive rebounding with Dale Davis at center. Sabonis came back in ’03 to play a limited role.

Regardless, Portland was a top-10 team in total rebound percentage from ’00 to ’03, according to NBA.com. They were also in the top-eight each year in offensive rebounding and no worse than 12th in defensive boards.  The Blazers from ’11 to ’14 were hot and cold on the glass, though. In their seasons as a playoff team — ’11 and likely ’14 — they’ve been both the best offensive rebounding teams and at stopping the fast break. In their lottery-bound seasons of ’12 and ’13, however, they were a bottom-10 team in each category. Defensive rebounding percentage over those four seasons has been consistently below average, never above 18th.

In the years following ‘Sheed’s stint with Portland, his rebounding percentages fluctuated. They were often higher in Detroit but dipping in Boston. (Bill Simmons was especially not happy with his performance as a Celtic.) As for his cup of coffee with New York, I pretend it doesn’t really exist.

Meanwhile, Aldridge’s rebounding used to be something that neither jumped out nor was worth getting too frustrated about. Through one-fourth of this season, it’s helped him become an MVP candidate.

Can he keep it up?

All statistics via Basketball-Reference unless noted otherwise.

Overreaction of Week 1: Josh Smith’s shot selection

overreaction

This post was initially devoted to all sorts of weird happenings over the first week of the NBA’s season. Michael Carter-Williams and the 76ers tanked so hard they ran over every team with their tank (until the Warriors ran them out of their own building), Boston was in pole position for the 2014 Draft as a result of the 76ers’ (and Suns’) unexpected starts, there were struggles from Derrick Rose and John Wall, and Milwaukee’s bench (21.5 points per game per-48-minutes) was the third-stingiest in the league and gave the incredibly average Bucks some hope for the postseason again.

But screw it. Of all the storylines to discuss, I wanted to write about what could possibly be this decade’s Rasheed Wallace in Detroit: Josh Smith. We’ll take a look at his offense through three measly games.

Last season, Smith took 363 shots (!) between ten feet and the arc which were good for just 30.5 percent. He also made only 29.9 percent of the 221 threes he hoisted. Overall, he was only a 30 percent shooter when he took jump shots. That’s just not acceptable for anyone, let alone a player where well over half of his field goal attempts were came from them.

What’s actually most frustrating though is how good he was around the rim at 77.1 percent, yet only about a third of his shots came from that area. His PER of 17.7 was his lowest since 2009, his three-point attempt rate of .170 was the highest of his career, and he recorded -0.3 offensive win shares. (All the stats listed so far are according to Basketball-Reference.)

It triggers the same reaction I had about Wallace, who’s now on the sidelines for the Pistons: Just get in the paint! Wallace was a much better three-point shooter than Smith has ever been, but the Pistons of the mid-2000s could’ve used more of a paint presence alongside the barrage of mid-range jumpers they were known for taking (but at least they made a respectable percentage of them).

Fast forward to this season as Smith enters the first year of his four-year, $54 million contract with the Detroit Pistons. The paint, where Smith is so good yet often neglects, is even more crowded with Andre Drummond and Greg Monroe starting alongside Smith, who’s now playing small forward. 25.6 of Smith’s 40 minutes per game have been spent with Drummond and Monroe with respectable results so far. Detroit’s outscored their opponents by 1.4 points per 100 possessions when all three are on the court.

But Smith’s shot selection has been controversial as usual. He’s averaging 7.3 three-point attempts per game — including an 11-attempt outing in a three-point loss at Memphis — and making only two on average. That’s good for 27.3 percent and he’s shooting only 20 percent on jump shots overall. Smith’s more than doubled his three-point rate from 2013, with 44 percent of his shots coming from beyond the arc. If anything, the frequency of his three-pointers could turn into a drinking game.

As a result, his free throw rate has been sliced by more than half. Smith’s typically been below average from the line, shooting a career-worst 51.3 percent last season, so there could be a correlation between that percentage and the decline in free throw attempts overall. But it could also be the result of a feeling out process now that Smith is playing with two frontcourt players who also work around the painted area.

There’s good news, though. Check out his shot chart through three games:

Shotchart_1383690868809

He hasn’t hugged the dead zones (at least so far) like in previous seasons. Only five of his first 50 shots have come between ten feet and the arc while eight have been attempted from five to nine feet where Smith has also typically struggled (and continues to do so, making just two shots from that area so far).

The rest of his shots (15) have come within five feet where Smith’s been terrific, making 13 of them for an 86.7 percent mark. It would be nice to see more of his shots taken there—as well as his three-point rate dropping back to a less-ridiculous level for his skill set—but Smith would be viewed differently so far if a couple more of those threes dropped.

If anything, his shot chart actually looks promising even if all the X’s from the arc say otherwise. If he’s going to chuck the long-range jumpers — and there’s barely a difference in accuracy between his 18-footers and three-pointers — wouldn’t you rather have Smith chuck from behind the arc? If both go in at a 30 percent clip, it’s an extra 0.3 points per attempt when Smith shoots from three. Whether that cures the headaches of fans of Detroit though is anyone’s guess.

There’s plenty of time to bring Smith’s game to the paint more frequently—and whether Pistons head coach Mo Cheeks wants it there—and for his jump shot to be a little less brick-worthy. Here’s the most Josh Smith three pointer of them all, by the way, unfortunately happening in the preseason:

We’ll see if his offense improves as the season goes on or if dedicating a post to his shot selection, with a tiny, tiny sample size, was just a waste.

%d bloggers like this: