This is the first of a two-part series, this one featuring the cloud hanging over Danny Granger’s future with Indiana. Click here for part two.
With already 21 wins, it’s easy to forget that the Indiana Pacers haven’t been at full strength this season. That is, until Danny Granger came off the bench last night after missing the first 25 games of the season with a strained calf. In a contrast of styles, the Pacers beat the Rockets by 33, coincidentally the number on Granger’s jersey.
Granger finished with only two points on 1-for-7 shooting, but he showed the potential of getting back to the player he used to be. Not since 2012 has he looked like himself, when the Pacers were nearly 12 points better per 100 possessions when he was on the court, according to NBA.com. He led them both in scoring and usage rate for both that season and, at the time, their most memorable playoff run in years. Indiana wasn’t the same when he was on the bench, a bottom-five team in scoring efficiency and mediocre defensively.
Indiana has also improved from within. This is no longer the Granger-led team from 2008 to 2012, the latter season being the one when Lance Stephenson was a go-to guy in garbage time (he even had a 45.8% usage rating in the playoffs). He’s become a proven, reliable shooting guard since then and can compliment the starting lineup and/or leads the second unit. Meanwhile, Roy Hibbert has become a defensive monster that’s lived up to his new contract.
The improvement that impacts Granger the most, though, comes fromPaul Georgewho, after faltering in the 2012 playoffs but breaking out in 2013, is now Indiana’s starting small forward until at least 2018. It’s an awkward spot for Granger who was Indiana’s first franchise cornerstone after they traded away nearly everyone involved in the Malice at the Palace. They’ve become a title contender without him and, in the process, have a small forward who’s having a better season than he ever had.
And Granger might not be around much longer, currently in the last year of a five-year deal worth $60 million. Given his recent injury history, his likely role off the bench this season and the $14 million he’s making this year, his next contract will certainly be cheaper. Indiana has only so much room to maneuver without dipping into the luxury tax, and any money thrown at a Pacer this summer will likely be given instead to Stephenson (which has been discussed here). He’s seven years younger than Granger, the only other impact player coming off the books, and the only starter without a long-term deal. Given the improvements Stephenson’s made in his first four seasons, Indiana might not even be able to afford him either.
Losing either one of those players, let alone both, would be a bummer given how much they’ve developed with Indiana. Stephenson has become a key piece to a title-contending team despite 39 players taken ahead of him in the 2010 Draft, but Granger led the franchise from their rock-bottom seasons in the mid-2000s to when they gave the Miami Heat their first major scare of the 2012 playoffs. Indiana’s been a thorn in the Heat’s side ever since, but Granger’s been an afterthought. That is, until last night when the fans at Bankers Life Fieldhouse welcomed him back with a standing ovation. They did the same when he made his first field goal:
But Paul George had some highlights of his own, including a fast break dunk that brought the house down. He led the team in scoring all while hasslingJames Hardenon the defensive end, a typical night from one of the premier players in the league. At one point, Granger was one of those guys.
How much of Granger’s future involves Indiana remains to be seen. He might even be gone before the trade deadline. It would be a cruel ending to his career as a Pacer, but the NBA is nonetheless a business.
The best scenario for both sides? Indiana lets Granger walk this summer, but only after he plays a pivotal role in helping the franchise win a championship. It would be a fitting end for a player who helped rebuild the Pacers from the bottom up, even if they may have won without him.
Just another reminder: This post isn’t meant to crap on Indiana’s great start by looking ahead to the trade deadline and summer. The next post will be devoted to some interesting lineups Danny Granger can be featured in.
These are my thoughts at 3 a.m., which carried over to a morning with just a couple hours of sleep.
We should’ve seen a performance like last night coming, especially after what happened last year when the Spurs rested Tim Duncan, Manu Ginobili, Tony Parker and even Danny Green against Miami. The Heat needed 47 minutes and 55 seconds to pull away from a “depleted” Spurs squad, one that got a double-double out of Matt Bonner, no less.
Despite the excitement that came from a near-upset over the Heat, the Spurs got tacked with a fine for resting four-fifths of their starters. There was no fine for resting Duncan, Ginobili, and Parker last night against Golden State. All they left with was a victory over a Warriors squad trying to find themselves again since Andre Iguodalareturned from a strained hamstring.
Golden State also might’ve leaked their frustration over Twitter:
Last night wasn’t a mega-Ewing Theory because the Spurs aren’t vastly overrated and Duncan won four rings from 1999 to 2007, though it was understandable to write them off last night when their starting lineup gave us a clue of what we could possibly see in 2016.
What they could be, though, is the NBA’s version of the Monstars. It’s entirely possible that Duncan, Ginobili, and Parker transferred their talents over to Boris Diaw, Marco Belinelli, and Patty Mills as soon as the former three were scratched from tonight’s game, right? Right?!?!
To be fair and not so weird, Diaw has already been one of the best players in the post this season. He’s fourth in the league in post-up efficiency, according to Synergy, averaging 1.13 points per possession over 38 tries. He’s also been oddly effective in isolation by finishing with scoops and hook shots, averaging 1.36 points per possession in those specific situations. Meanwhile, Belinelli has been on fire this season by shooting a league-leading 53.2 percent from three and 60 percent in catch-and-shoot situations, according to SportVU. Mills has also been a hot hand in limited time with shooting splits of 47.3/43.4/80 and a PER of 18.9.
But each put up a hell of a performance last night. Diaw was dunking and making chase-down blocks like he was jumping off a trampoline that didn’t collapse from his own weight, Patty Mills made huge plays in crunch time, and Belinelli was unstoppable off the bench while also being my player of the game, scoring 17 points in the third quarter and 28 points in 29 minutes. At one point I had to tweet this nonsense:
It was other-worldly even after factoring in Diaw’s performance in last year’s Finals, Belinelli’s streaky shooting in general, and Mills’ intense towel-waving. We also can’t forget Tiago Splitter‘s game-winner.
But you could also compare the Monstars to other teams in the NBA. After all, the Nerdlucks stole the talent of the NBA’s best players and Shawn Bradley. Were the Heat the Monstars of 2011? What about Daryl Morey over the last two seasons?
Maybe Gregg Popovich is just a really, really good coach. Switch him with Randy Wittman and let’s see how good the Spurs are without their three franchise cornerstones. Even with Pop, it’d be interesting to see how the they would do in the East.
Depending on what you characterize as “crunch time”, though, the sample sizes can be even smaller than the ones I included for this post. For example, if it means when there’s one minute left in a close game then some teams will have only totaled 10 to 15 minutes. There would also be a ton of free throws and last-second situations, which makes for inflated offensive ratings and pace.
FUN FACT: Only the Raptors have a pace below 100 with one minute left in crunch time, according to NBA.com, which makes sense when Dwane Casey has a knack for wasting 2-for-1 opportunities and/or not fouling when down with 25 seconds left:
Every other team has a pace ranging from 116 to 156. If we define crunch time as within five minutes left and either up or down by five points (like what I used to determine the go-to players), the pace goes down to anywhere between 90 and 105. We also get a larger sample size between 30 and 80 minutes, depending on the team.
Let’s see how this works out, beginning with the best and worst 10 teams according to net rating and then by shooting percentages.
Net Rating
The top 10
Team
MIN
W
L
OffRtg
DefRtg
NetRtg
+/-
PACE
Memphis Grizzlies
37
7
4
125.2
83.8
41.4
29
88.98
Portland Trail Blazers
51
12
2
133.9
95.5
38.4
49
101.28
Indiana Pacers
40
9
2
117.5
94.7
22.8
24
95.91
Philadelphia 76ers
64
6
7
115.1
94.2
20.9
10
105.18
Oklahoma City Thunder
48
10
3
115.9
98.8
17.1
18
104.18
Dallas Mavericks
47
9
7
105.7
90.9
14.8
26
92.86
Denver Nuggets
39
8
4
108.6
95
13.6
15
104.43
Phoenix Suns
49
10
6
112.5
99.2
13.3
15
95.24
Utah Jazz
46
5
6
123.4
112.3
11.1
15
94.64
New Orleans Pelicans
64
6
6
117
106
10.9
-4
95.89
It’s weird to see a positive net rating for the Pelicans when their plus-minus is negative four. I’m not exactly sure how that happened or how it happens in the first place.
The Marc Gasol-less Grizzlies are at the top, though. They’re the best defensive rebounding team in the league in crunch time, grabbing 85.3 percent of opponent’s misses and allowing only four second-chance points. Memphis also grinds the game to a halt, relinquishing only two fast break points and 22 points in the paint. The former stat ties with Miami for best in the league while the latter ties for second with Indiana and San Antonio. (Dallas is best at preventing points in the paint during crunch time by allowing only 20 over 46 minutes of play. Utah is near the top of that list, as well as in least fast break points allowed.)
Memphis seems misleading offensively, however. 35 of their 87 points come at the line, they’re horrible from the arc and they don’t get second chance or fast break points. Their offensive efficiency should drop in time and their defensive efficiency should take a hit without Gasol, though Tony Allen remains as a key defensive cog.
For the Blazers, they squeak into the top 10 in fast break and second chance points but blow teams away from the arc, shooting 18 for 39 on threes. It also helps when Damian Lillarddoes Damian Lillard things:
The Jazz are also up there in scoring efficiency, mostly thanks to shooting nine for 16 from three and a good dose of (gasp) Marvin Williams. Meanwhile, Oklahoma City has actually been terrible from the field, shooting just 15 for 60 on shots outside of the restricted area. It’s like them and the Jazz got their stats mixed up.
More on shooting percentages in a bit. Let’s look at the 10 worst teams in crunch time, according to their net rating:
The bottom 10
Team
MIN
W
L
OffRtg
DefRtg
NetRtg
+/-
PACE
Brooklyn Nets
41
4
8
80.1
106
-25.9
-32
102.7
Chicago Bulls
70
4
9
91
115.2
-24.3
-26
94.14
Golden State Warriors
59
5
7
88.4
112.4
-24
-24
95.38
Sacramento Kings
52
3
8
88.4
105.7
-17.3
-22
91
Orlando Magic
55
5
10
93.2
109.4
-16.1
-21
101.24
Atlanta Hawks
48
7
8
94.8
109.6
-14.9
-19
91.05
Milwaukee Bucks
62
4
9
96.9
109.8
-12.9
-19
101.23
New York Knicks
54
4
10
87.4
100.3
-12.9
-18
93.97
Charlotte Bobcats
41
6
8
91.5
104
-12.5
-15
100.9
Cleveland Cavaliers
54
7
7
92.7
103.3
-10.6
-9
92.51
It’s interesting that Toronto’s not up there until realizingRudy Gay was pretty good in late-game situations.
Quite a few of these teams are at or near the bottom 10 in allowing fast break and second chance points. They also give up a few more free throws. 22 of Golden State’s 54 free throws allowed, for example, have come within one minute left. The discrepancy of fouls drawn is huge within one minute as well, with Golden State only drawing two compared to being whistled for 14.
It’s odd that Golden State has one of the worst net ratings since Stephen Curry has been one of the best in crunch time, but the foul discrepancy over the final five minutes of close games is pretty consistent with the best and worst teams. Four of the top five with the largest foul differential not in their favor are also in the bottom 10 teams in regards to net efficiency. Meanwhile, four of the top five with fouling in their favor are in the top 10.
Large positive and negative net ratings are typical over the course of a season, but the small sample sizes allow for change over the next four months. Shooting percentages can also change. Let’s take a look at the 10 best and 10 worst shooting teams in the crunch, sorting them by effective field goal percentage.
Shooting Efficiency
The top 10
Team
MIN
eFG%
NetRtg
AST%
Field Goals
FG%
3FG
3FG%
FT
FT%
Portland Trail Blazers
51
0.581
38.4
0.512
41-86
47.7
18-39
46.2
48-58
82.8
Phoenix Suns
49
0.564
13.3
0.442
43-86
50.0
11-28
39.3
21-27
77.8
Philadelphia 76ers
64
0.562
20.9
0.560
50-97
51.5
9-22
40.9
42-55
76.4
Utah Jazz
46
0.549
11.1
0.514
35-72
48.6
9-16
56.3
35-44
79.5
Denver Nuggets
39
0.534
13.6
0.630
27-59
45.8
9-23
39.1
31-49
63.3
Miami Heat
35
0.519
8.6
0.696
23-52
44.2
8-20
40.0
24-32
75.0
San Antonio Spurs
30
0.508
-6.0
0.586
29-61
47.5
4-14
28.6
11-18
61.1
Dallas Mavericks
47
0.507
14.8
0.529
34-73
46.6
6-17
35.3
28-33
84.8
Memphis Grizzlies
37
0.500
41.4
0.542
24-52
46.2
4-14
28.6
35-42
83.3
Los Angeles Clippers
48
0.494
7.9
0.429
35-80
43.8
9-23
39.1
42-56
75.0
Weird note: Dallas and Phoenix already have 16 games that qualified for crunch time numbers, the most in the league. San Antonio has had the least games by far, with only 8.
I was expecting a lot of the Suns’ threes coming from drive-and-kick situations thanks to Eric Bledsoe and Goran Dragic, but most came from shots off the dribble. Gerald Green had one contested fast break three that displayed terrible judgment, but went in anyway. Whatever.
Not surprisingly, though, the best effective field goal percentages come from the teams draining threes. There are also teams you would expect to be at the top: Miami, San Antonio, Dallas, the Clippers, and probably Portland. “Star-less” teams like the Jazz and Nuggets are also shooting better than the Knicks, for example. More on New York in a bit.
There’s also a pretty big difference in assist percentage between the best and worst, among other stats. It’s no surprise that Toronto, Cleveland, Detroit, and Charlotte are at the bottom of that statistic when each often rely on their point guard or a wing to go one-on-five. And just like that, I spoiled nearly half of the bottom 10 teams:
The bottom 10
Team
MIN
eFG%
NetRtg
AST%
FGM
FG%
3FGM
3FG%
FT
FT%
Charlotte Bobcats
41
0.340
-24.3
0.348
23-72
31.9
3-18
16.7
27-33
81.8
New York Knicks
54
0.346
-10.6
0.607
28-91
30.8
7-36
19.4
31-35
88.6
Chicago Bulls
71
0.365
-17.3
0.579
38-115
33.0
8-30
26.7
33-44
75.0
Milwaukee Bucks
63
0.368
-12.9
0.516
31-95
32.6
8-23
34.8
36-46
78.3
Toronto Raptors
44
0.372
-2.5
0.346
26-78
33.3
6-20
30.0
22-35
62.9
Cleveland Cavaliers
54
0.390
-12.5
0.333
36-100
36.0
6-26
23.1
29-43
67.4
Detroit Pistons
51
0.392
-24.0
0.313
32-88
36.4
5-18
27.8
28-38
73.7
Brooklyn Nets
42
0.397
-25.9
0.440
25-68
36.8
4-19
21.1
14-27
51.9
Indiana Pacers
40
0.400
22.8
0.520
25-70
35.7
6-22
27.3
41-49
83.7
Golden State Warriors
60
0.410
-14.9
0.472
36-100
36.0
10-34
29.4
22-29
75.9
A few of these teams were expected to struggle. The Bulls and Nets have been depleted, Milwaukee’s a mess, and the Pacers – wait, what? Like last year, Indiana barely squeezes into the bottom 10 in shooting efficiency. Their free throws help put them in the middle of the league in true shooting, however. Overall, their offensive efficiency is about average.
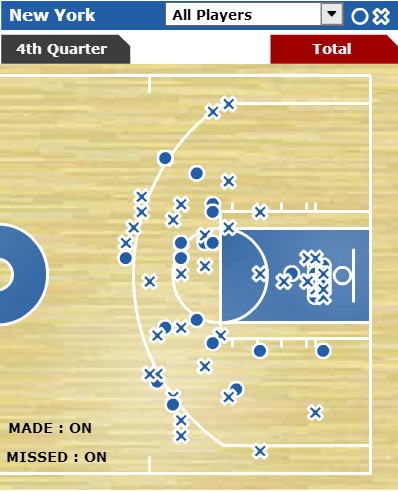
At the bottom in effective field goal percentage are the Bobcats. Charlotte can’t seem to make anything outside the restricted area, but they have nothing on Carmelo Anthony, J.R. Smith and the rest of the Knicks. If we fiddle around with the minutes that represent crunch time, we get this out of New York:
More Knicks stats in crunch time
Time
MIN
OffRtg
DefRtg
NetRtg
FG
FG%
3FG
3FG%
FT
FT%
Last 2 minutes
21
83.6
83.3
0.40
8-42
19.0
0-18
0.0
22-26
84.6
Last 1 minute
11
71.3
90
-18.6
4-25
16.0
0-14
0.0
12 16
75.0
Those field goal percentages are dead last in the league. Only two of the made field goals within two minutes have come outside the paint (two-for-25). That should change for the better with Tyson Chandlerreturning as soon as tonight. It can’t get much worse, though I’ve come to expect the unexpected from New York.
Overall, the sample sizes are admittedly small but nonetheless worth looking at. There’s plenty of time for teams to turn things around but an awkward outlier or two will probably remain, like when the Charlotte Bobcats and the post-LeBron James pre-Kyrie Irving Cleveland Cavaliershad two of the best net ratings in crunch time in 2011. Miami will likely creep their way into the top 10 in terms of net rating as well. They’re just too suffocating to be left out.
What if I told you two days ago the Detroit Pistons had a 13-point fourth quarter lead against the 20-win Blazers, only to blow it and lose on a buzzer-beater by Damian Lillard? Not only that, butJosh Smith scored 31 points on only 17 shots.
We’ll probably never see that efficient of a performance again by Smith, who Detroit should’ve kept feeding the ball to while they had a double-digit lead. Unfortunately, he only took one shot in the fourth quarter and overtime combined. Detroit wouldn’t let that happen twice in a row, not even against the best defense in the league in Indiana.
For better or for worse, Smith was chucking all game last night against the Pacers, nearly mimicking the ESPN documentary series by finishing with 29 shots and 30 points. There were moments of brilliance that were overshadowed by frustrating shot selection: fade away jumpers, long twos with 12 seconds on the shot clock, isolations leading to more long twos. All three of those kind of shots by Smith resulted in barely grazing the rim when they didn’t go through the net. When the first long two swished, Indiana must’ve had an evil grin knowing Smith would continue flirting outside the paint.
And for the most part, he did:
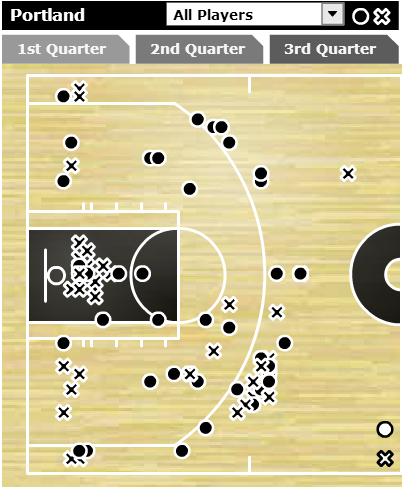
Josh Smith’s shot chart versus Indiana
As you can see from the shot chart above, long jumpers accounted for over half (!!!) his attempts, bringing back memories of Rudy Gay‘s performance against Houston. Though Smith was effective from those spots percentage-wise, he was at his best when he scored by moving off the ball. Twice he took advantage of miscommunication between Paul George and whoever was guarding Greg Monroe.
Rather than showing Smith’s baskets from moving without the ball by pasting screenshots that take up a ton of space, I put them in a short video with captions up top:
Smith could’ve easily sat around the perimeter, hoping Brandon Jennings would feed him for, you know, a jumper he only makes 25 percent of the time on over 200 attempts, according to NBA.com. He produces just 0.68 points per spot-up shot, according to Synergy, ranking 205th in the league. That’s not good when 20 percent of his shots come from that situation.
Good thing Smith cut to the rim instead, an area where he shoots nearly 67 percent from and produces 1.24 points per attempt (35th-best). He also showed off a lefty jump hook last night, one he doesn’t take anywhere near as often probably because of the cramped spacing between him, Monroe, and Andre Drummond. Not a lot of those hook shots dropped versus Luis Scola, Paul George or David West, but for the season he’s 24-of-44. Efficiency!
But those efficient shots were scattered between the long jumpers Smith chucked to varying degrees of success. Maybe he took more of them than usual because of Mount Hibbertlurking in the paint, but they’ve become a daily occurrence regardless of the opponent. It puts an earlier blog post praising his shot selection to waste, though it does make Detroit handing Indiana their first home loss of the season that much more impressive.
This is an attempt to start a weekly series where I look at unusual shot charts and post them here. They balance out over a season to what a team wants to do, like Houston straying away from mid-range shots, but unusual shot locations can emerge each game. It’s why I wanted to start a weekly series as long as it doesn’t turn out messy or jumbled.
In the future, I could also go into more depth than I did for this post or look at individual players instead of teams. For now, though, check this out:
Miami Heat and Detroit Pistons, December 8
Detroit’s allowed the second-most attempted corner threes per game, 7.3 according to NBA.com, and that’s where Miami teed off from last Sunday. Detroit either over-helped or fell asleep, some of that being expected when LeBron James bends defenses until they break. There was one instance, though, where James directed every Heat player on the floor to the left side, save for Ray Allen, and Detroit didn’t adjust. It was one of the easiest corner threes of Allen’s career.
As for Detroit’s offense, they bricked all but one mid-range shot. Give credit to Miami for the bad offense on a ton of possessions, though. They forced more than a few difficult passes, ones off course just enough to where shooters spotting up for three had to take a couple steps inside the arc to catch the ball. The Pistons are actually in the bottom-five in attempts from both the 10-14 foot areas and 15-19, according to NBA.com. That’s a little surprising when Josh Smith is on the team, but not so much when Greg Monroe and Andre Drummond start at power forward and center, respectively.
Miami bagged the win, 110-95.
Phoenix Suns, December 10 at Los Angeles Lakers
The Suns missed all of their attempts from the left side while hot from the right side, at least from the elbow down. The Morris twins were responsible for most of the mid-rangers in that hot patch on the right side, while Goran Dragic made two of the corner threes.
The Suns won 114-108 and continued a start to the season that was hardly expected.
New York Knicks, December 11 versus Chicago
This was perhaps the ugliest game I’ve watched all season. The Knicks took a ton of mid-range shots, especially from above the elbow, and shot only two corner threes. For the season, they’re in the top-10 in both mid-range shots attempted and above the break threes, but in the bottom-10 everywhere else.
Gross.
The Knicks won, though, 83-78.
Houston Rockets and Portland Trail Blazers, December 12
Perhaps my favorite game of the season and definitely one that put Portland on the national spotlight if they weren’t already there. It was a contrast in styles. Both teams like to tee off from the arc, but Portland takes three times as many mid-range shots per game than Houston. In fact, every other team takes at least twice as many as the Morey Ball-Rockets.
LaMarcus Aldridge didn’t care, draining a of those mid-rangers in the chart above. Portland won, 111-104.
San Antonio Spurs, December 13 versus Minnesota
The Spurs really enjoyed that right corner three, a total of seven shots made from there. It’s just too hard to win games when your opponent scores over 20 points from the corner like that. Three of those corner threes came in the fourth quarter when the Spurs outscored the Timberwolves 37-21. It was quite the answer to Minnesota outscoring them 35-18 in the third, thanks to Kevin Love’s three-point barrage.
The Spurs won, 117-110.
Atlanta Hawks, December 14 at New York
Another Morey Ball shot chart. Barely any mid-range shots were taken, with a ton of those shots instead going towards threes, including a bunch from the corners. Atlanta took 32 attempts from the arc that night, making 15. 10 of those came from Louis Williams and Kyle Korver.
The Knicks still won, though, 111-106. Maybe they’ll trade for Kyle Lowry after all.
Portland Trail Blazers, December 14 at Philadelphia
So. Many. Threes.
Portland had a night reminiscent of when my rosters on NBA 2K6 had ratings of 99. They couldn’t miss (21 threes), they dished (41 assists), and they won in a blowout (139-105). Had the Trail Blazers scored one more point, they would’ve been the 11th team in league history to score 140 points while taking less than 20 free throw attempts.
Regardless, they set a franchise record with their made threes. It’s just not fair when a team takes nearly 40 shots from the arc and makes over half.